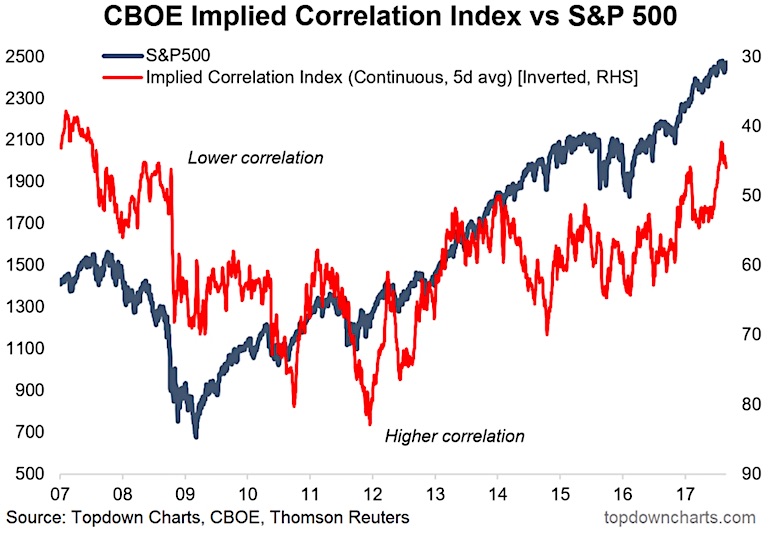
CBOE Implied Correlation Index Highlights Rising Risks For Investors
In this article we take another look at a somewhat obscure indicator "implied correlations".
The Implied Correlation Index comes from the CBOE and is a...
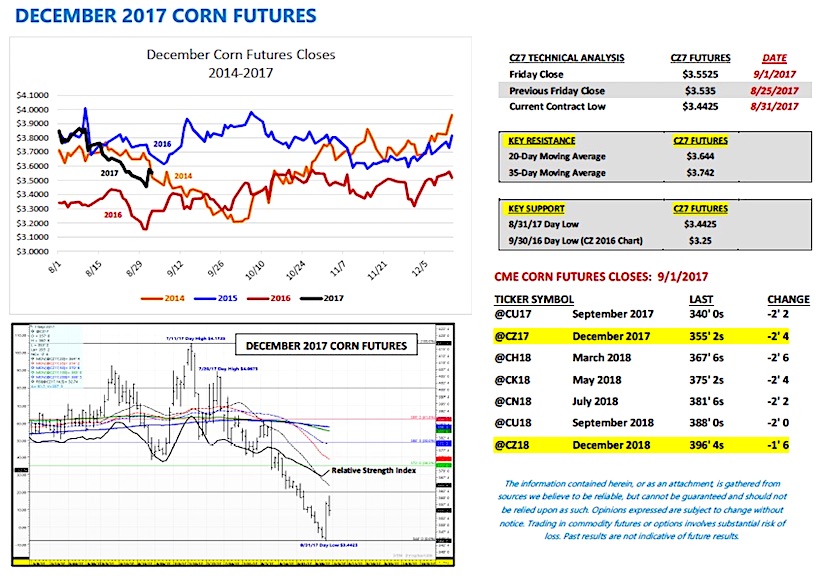
U.S. Corn Futures Market Outlook: Bulls Need A Catalyst
Corn Market - Weekly Highlights
Below is a list of key happenings in the Corn market and a few fundamental takeaways that traders should be...
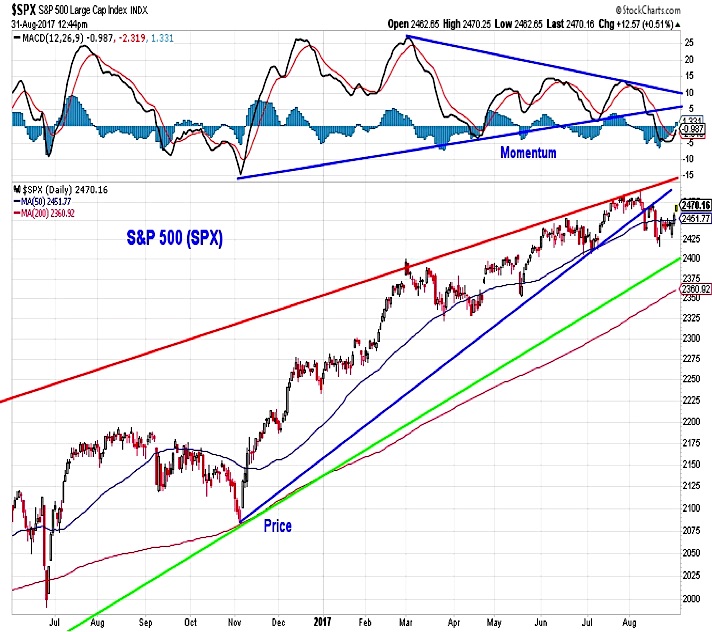
Weekly Stock Market Outlook: Is The Rally Sustainable?
In this week’s investing research outlook, we analyze the technical setup and macro trends of the S&P 500 Index (INDEXSP:.INX), check in on investor sentiment and...
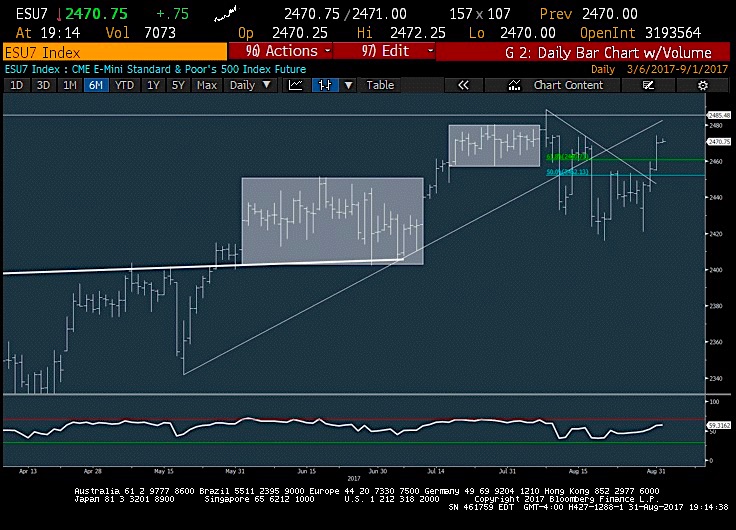
S&P 500 Trading Update: Bulls Eye Retest Of The Highs
S&P 500 Short-Term Outlook (2-3 Days): MILDLY BULLISH
The S&P 500 (INDEXSP:.INX) is getting a bit extended here and nearing key resistance as we start September....
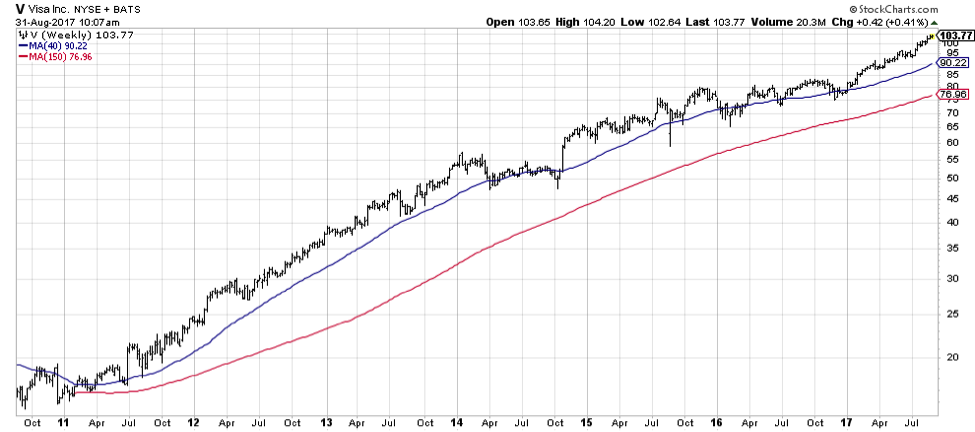
Making Sense Of A Market Of Stocks
I regularly run screens for stocks making new highs and new lows on different time periods. While it’s always been a source of new...
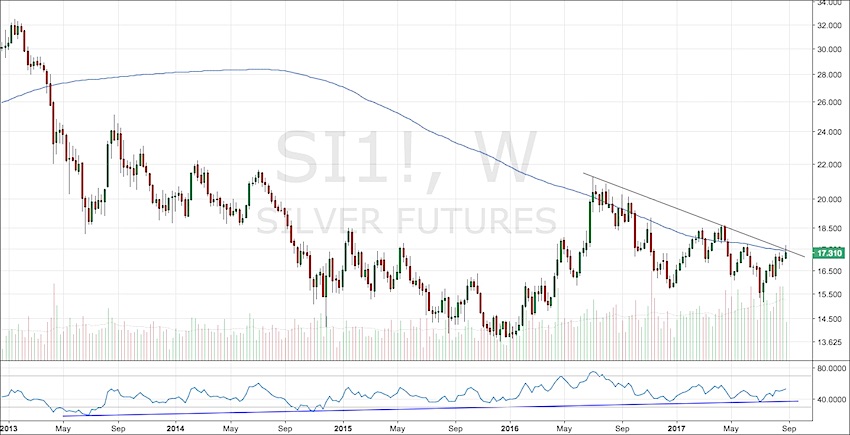
Is Silver Price Confirming Gold Sentiment?
Earlier this week market participants were exposed to some after hour fireworks - North Korea had launched a missile over Japan. As expected, gold...
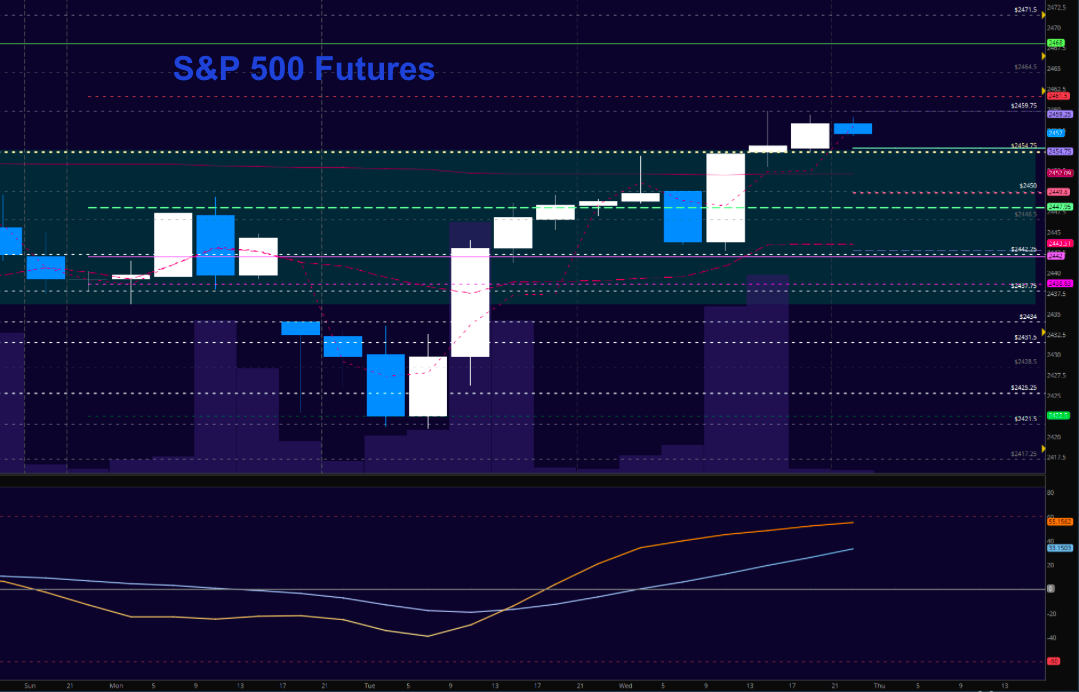
S&P 500 Futures Trading Outlook For August 31
Stock Market Futures Considerations For August 31, 2017
The S&P 500 Index (INDEXSP:.INX) is pointing higher again this morning as investors jump on the recovery...
Market Breadth Indicators Remain Bullish For Long-Term Investors
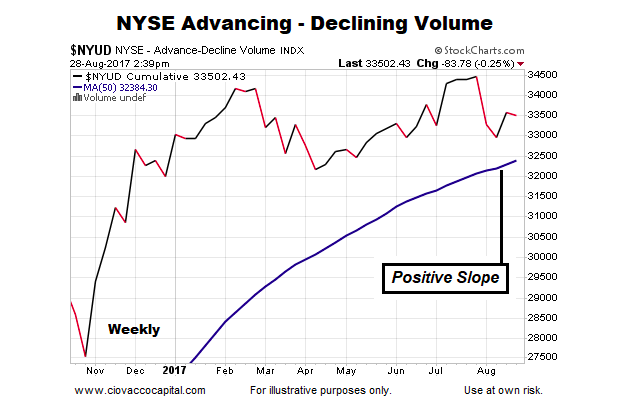
Volume-Based Market Breadth Indicator Still Constructive
The chart below shows up/down volume for the NYSE Composite Stock Market Index (INDEXNYSEGIS:NYA), along with its 50-week moving...
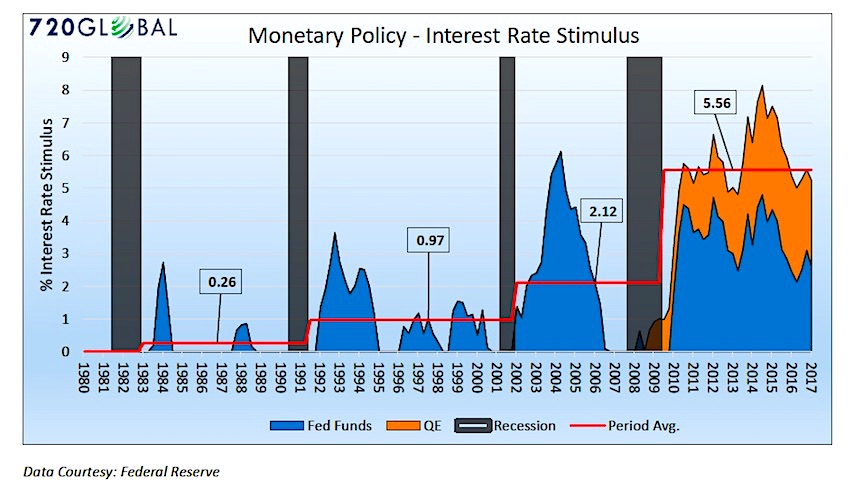
Monetary Stimulus: How Much Is Too Much?
The amount of monetary stimulus increasingly imposed on the financial system creates false signals about the economy’s true growth rate, causing a vast misallocation...
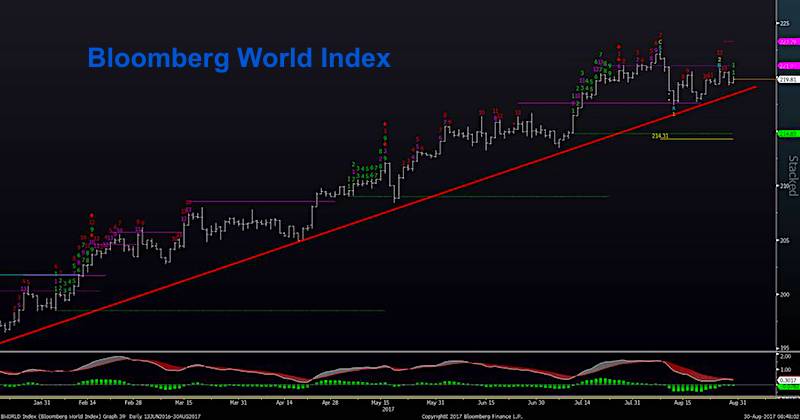
U.S. Equities Trading Update: Tech Sector Leads The Charge
We're seeing mild gains in the US and European equity markets following two key US economic reports: ADP data coming in 237k and GDP...

