I regularly run screens for stocks making new highs and new lows on different time periods. While it’s always been a source of new ideas, it also can serve as a perfect illustration of the market maxim, “It’s not a stock market, it’s a market of stocks.”
It’s very easy to think of “the market” as simply a broad index like the S&P 500 – NYSEARCA:SPY (which appears to be exiting yet another bull flag), but in reality there are lots of opportunities out there in pretty much any market environment.
By reviewing screens of stocks making new highs and new lows, I both make myself available for different ideas, and I also avoid the impact of the availability heuristic which can certainly skew your outlook.
I have met many investors who consistently make money with a top-down approach, focusing their efforts on making the “macro call” on broad equity indexes as well as other assets. I’ve also known investors that consistently perform well using a bottom-up approach, completely ignoring the big picture and just focusing on individual stocks.
I’m convinced there’s money to be made with both investing strategies, and that the key for investors is in selecting an approach that feels comfortable, then having the discipline to stick with it over time.
Books like William O’Neil’s How to Make Money in Stocks and Chuck Dukas’ The TRENDadvisor Guide to Breakthrough Profits taught me the value in respecting the overall market direction but focusing my efforts on stock selection.
So in a market that has been in a consistent uptrend and appears to be resolving through a corrective period, there may be opportunities on both the long and short side.
To say another way, for every stock ABC breaking to new highs, there is stock XYZ breaking to new lows.
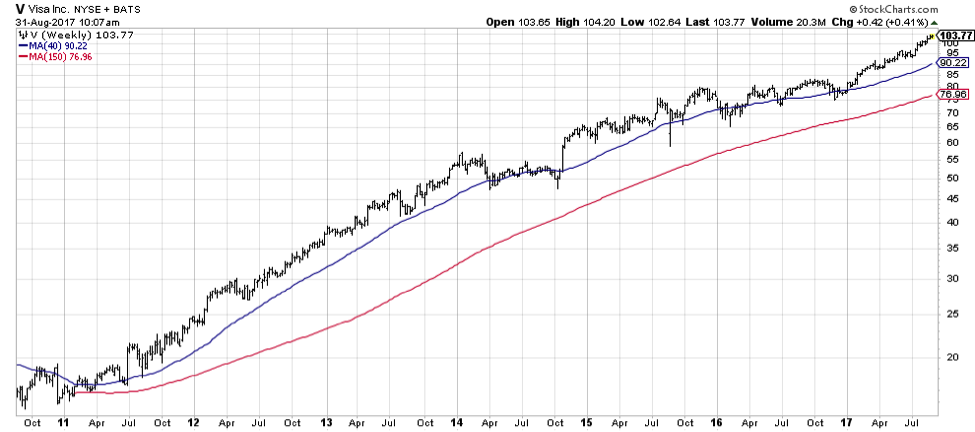
For every Visa Inc. (V)…
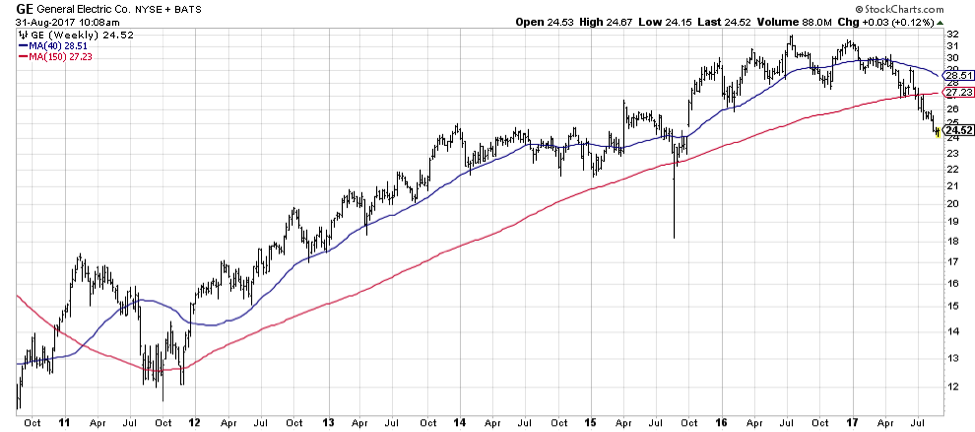
…there is General Electric Co. (GE)…
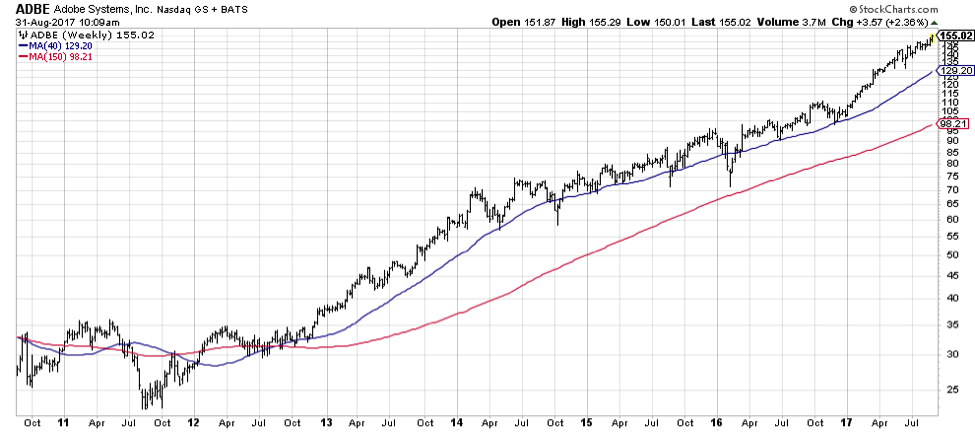
…and for every Adobe Systems, Inc. (ADBE)
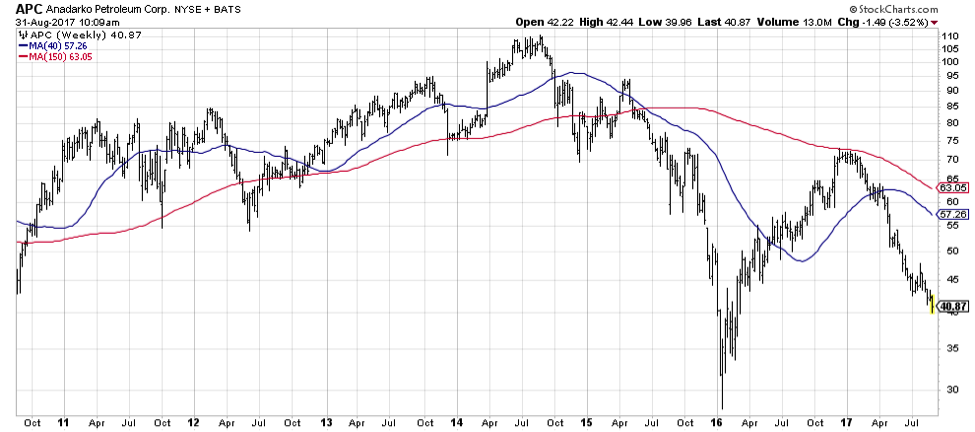
…there is an Apache (APC)…
For now, I’ll be monitoring the new highs and new lows lists in the coming weeks to see which stocks, groups and sectors appear in which lists. Most importantly, I know I won’t be caught off guard with any movements in the equity space.
Twitter: @MktMisbehavior
The author does not have a position in mentioned securities at the time of publication. Any opinions expressed herein are solely those of the author, and do not in any way represent the views or opinions of any other person or entity.
ALSO READ: The Sun Shines On Solar Stocks


