I regularly screen for ETFs making new 13-week highs or 13-week lows. This can help to identify emerging leadership before the move has already played out.
This week’s new high screen yielded three results: iShares MSCI India Index ETF (INDA), Robo Global Robotics and Automation Index ETF (ROBO) and Guggenheim Solar ETF (NYSEARCA:TAN).
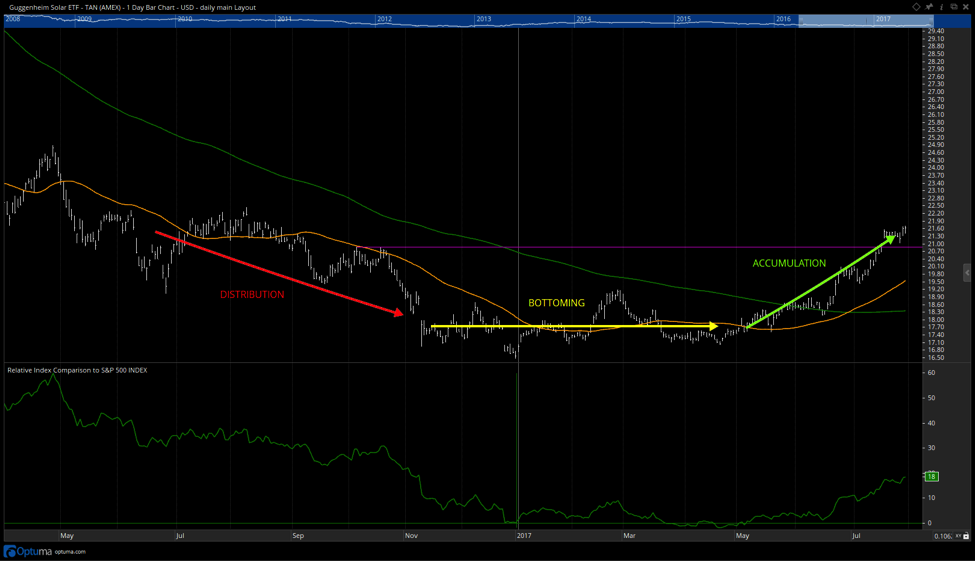
The TAN chart struck me as a great example of the transition from distribution to accumulation, as well as a solid reminder on how to avoid one of the common behavioral biases for investors- confirmation bias.
Here we see TAN in a Dow Theory uptrend, breaking above a previous resistance level, trading above two upward sloping moving averages. The solar ETF has also outperformed the S&P 500 by around 18% YTD. All bullish signs for the solar sector and select stocks.
This chart is a perfect example of a rounding bottom pattern, and also provides a textbook example of the rotation from distribution to accumulation.
If you own solar stocks, one of the worst things to do is bring up the chart and say something like, “I own it, I like it, and good news, the chart looks great too!” Chart analysis should always be done independently so as to avoid confirmation bias, where you first make a decision and then find evidence to back it up.
Inverting the price chart can be one way to disorient you just enough to limit the impact of confirmation bias.
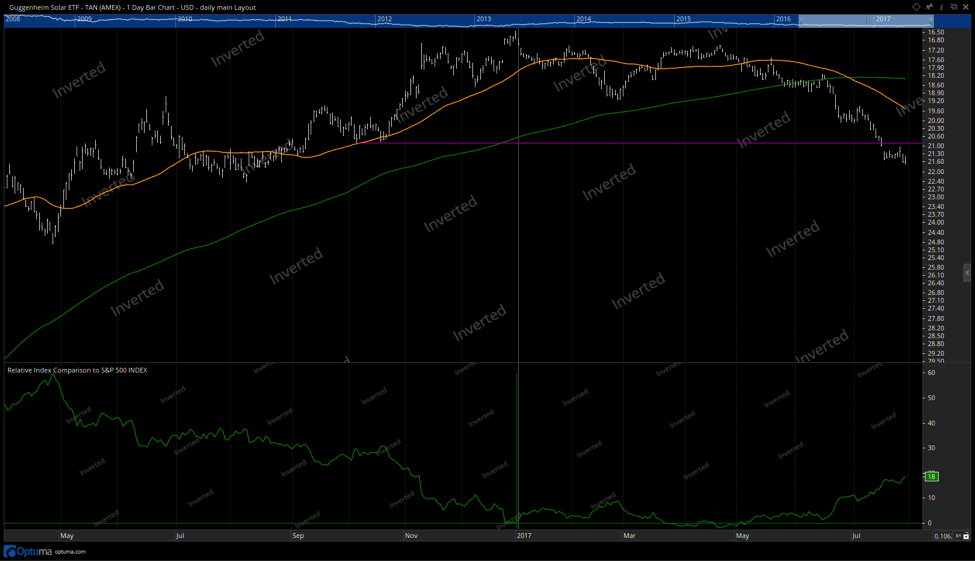
So now looking at TAN through a fresh (inverted) lens, what do we see? A clear breakdown through support, a Dow Theory downtrend, two downward sloping moving averages. Weight of the evidence? Bearish.
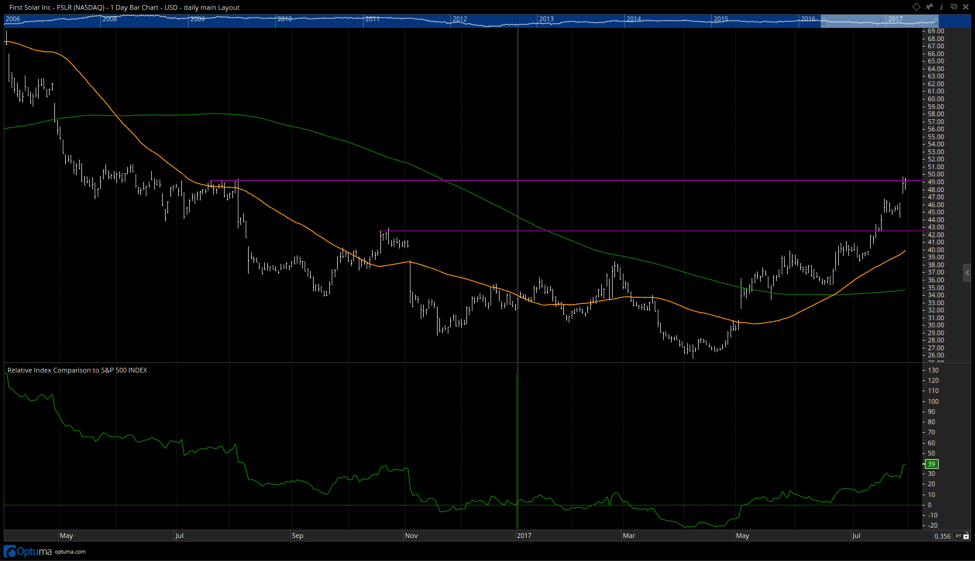
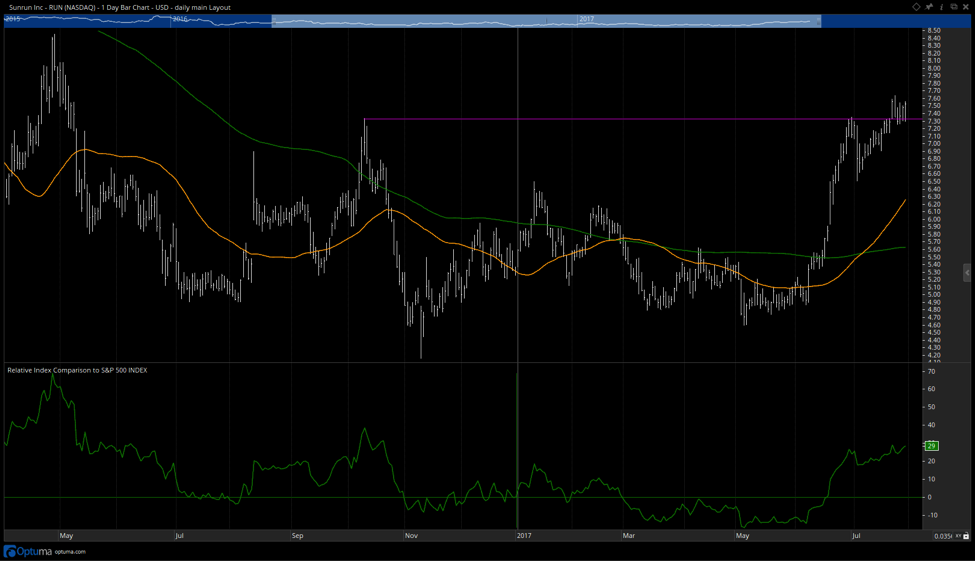
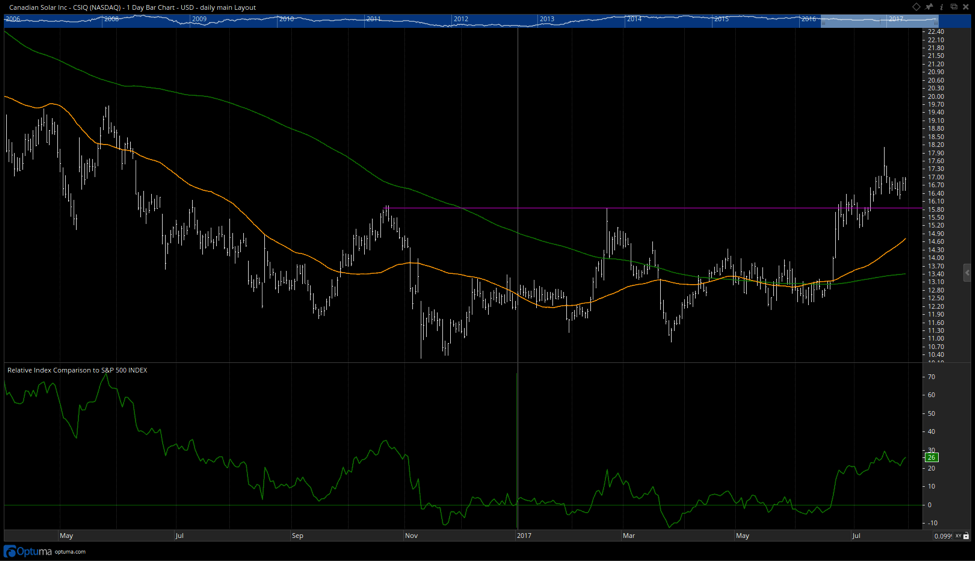
I like to review some of the components of an ETF to see what the different names look like and whether they confirm what I’m seeing from the ETF itself. In this case, many of the larger components, such as First Solar (NASDAQ:FSLR), Sunrun (NASDAQ:RUN), and Canadian Solar (NASDAQ:CSIQ) are showing similar bullish patterns of accumulation with breaks above resistance.
First Solar Inc Stock Chart (FSLR)
Sunrun Inc Stock Chart (RUN)
Canadian Solar Inc Chart (CSIQ)
Until we see some sort of price weakness (lower high, pullback to a moving average, etc.) the weight of the evidence for the solar sector and select stocks is bullish.
A little bit about myself: I am a Past President of the Market Technicians Association and currently serve as a Subject Matter Expert for Behavioral Finance. I formerly worked as a Managing Director of Research at Fidelity Investments in Boston as well as a technical analysis specialist for Bloomberg in New York. Check out my website marketmisbehavior.com.
Twitter: @MktMisbehavior
The author does not have a position in mentioned securities at the time of publication. Any opinions expressed herein are solely those of the author, and do not in any way represent the views or opinions of any other person or entity.


