In this week’s investing research outlook, we analyze the technical setup and macro trends of the S&P 500 Index (INDEXSP:.INX), check in on investor sentiment and market breadth indicators, and discuss emerging themes and news that we are watching closely right now.
Here’s a summary of our findings for the week ending September 1, 2017:
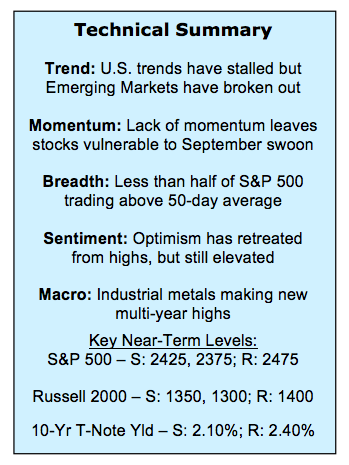
Relative Leadership Coming from Overseas – The price and momentum trend for the S&P 500 has stalled in August, opening the door for relative leadership from international indexes. Emerging Markets continue to gain strength and have broken out on a relative basis.
Broad Market Approaching Important Juncture – The broad market has seen significant deterioration over the past month. Further deterioration and/or a lack of confirmation of index-level improvement could prompt a downgrade of our view of breadth and increase the risk a near-term pullback.
Investor Optimism Easing but Still Elevated– Weekly sentiment surveys show that optimism among investors has retreated from its recent peaks but generally remains elevated. Short-term sentiment indicators which had shown some measure of pessimism are starting to show more complacency.
Dollar Touches Multi-Year Low – The dollar traded this week at its lowest level since 2014 before reversing off those lows. While the dollar is oversold and could bounce off of long-term support, price and momentum trends remain lower.
Stock Market Indicators
S&P 500 Index
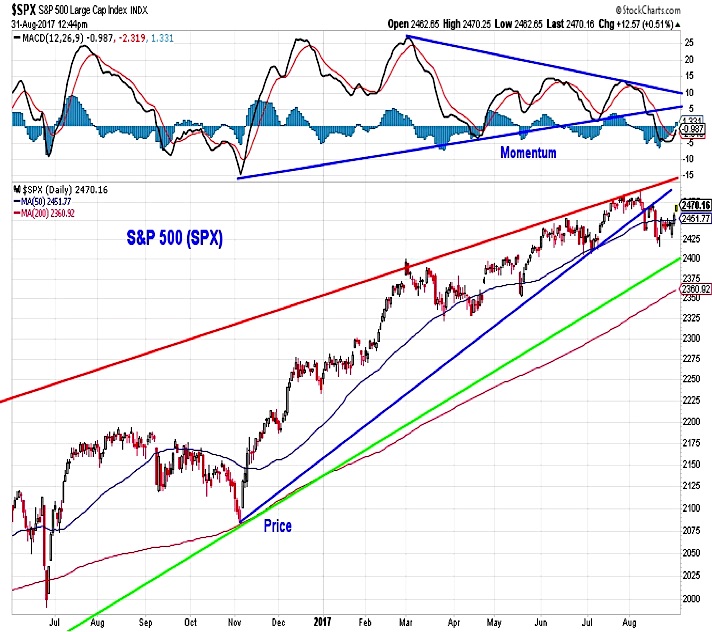
The S&P 500 appears set to finish in positive territory for the 10th month in a row. While it has recovered its 50-day average, the price and momentum up-trends that supported gains since the end of 2016 have been broken. Moving above 2475 would be the first step toward getting back in gear. If this fails, 2425 could be an initial support level on the way to a possible test of the 200-day average (which was last tested in November).
Emerging Markets Up-Trend
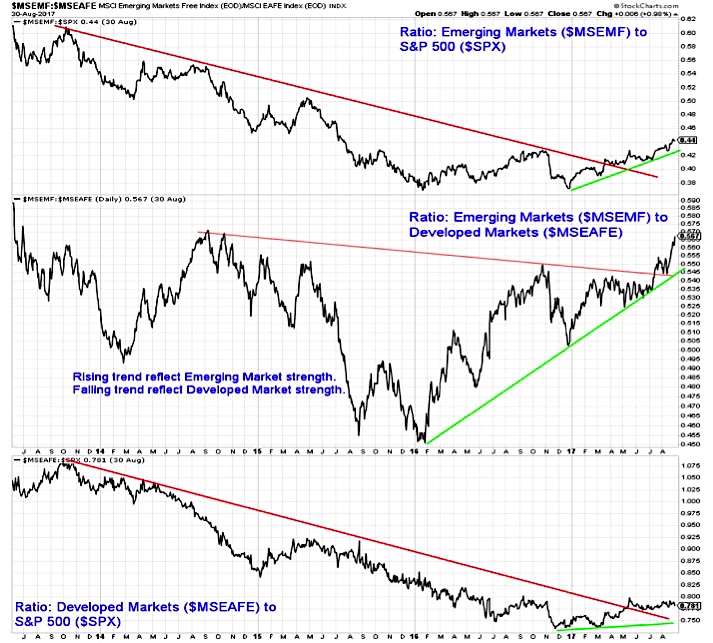
While conditions at home have stalled, relative strength continues to be seen overseas. Both Emerging Markets and Developed Markets have broken downtrends relative to the S&P 500 (seen in the top and bottom panels of this chart). Emerging markets also continue to gain strength relative versus Developed Markets (as shown in the middle panel). The relative up-trend that emerged in early 2016 has helped Emerging markets breakout relative to Developed Markets.
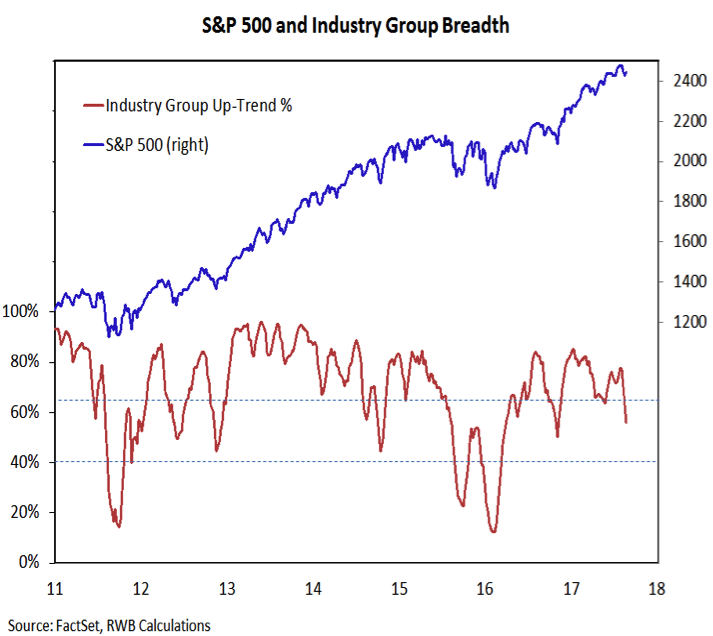
Market Breadth
The S&P 500 has bounced off its mid-month lows, but we have yet to see a meaningful improvement in our breadth indicators. The percentage of industry groups in up-trends continues to contract. Currently it stands at 56% – a break below the November 2016 low of 50% could represent a meaningful deterioration in breadth that could increase the risk of a September index-level swoon.
continue reading on the NEXT PAGE…

: Creating Bullish Divergence?")

: Creating Bullish Divergence?")


