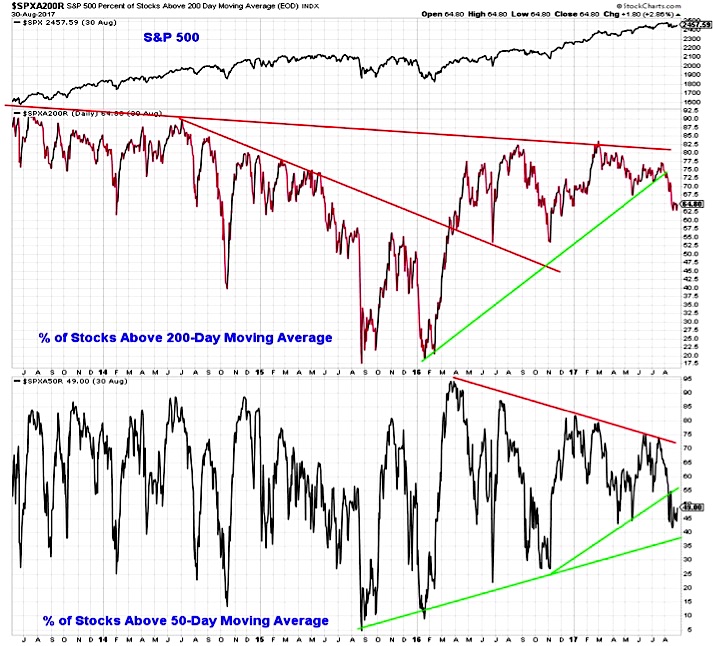
We are also watching the trends at the issue level. Less than half of stocks on the S&P 500 are trading above their 50-day averages and more than one third are below their 200-day averages.
If the trends at the index level improve but we fail to see a marked improvement in issue level trends, this too could leave the S&P 500 vulnerable to weakness.
Investor Sentiment
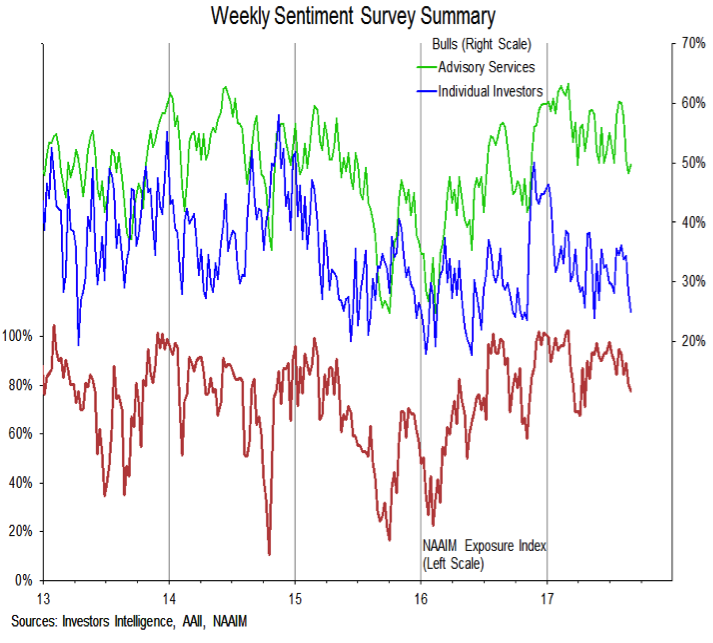
Both Advisory Service Bulls and the NAAIM Exposure index have retreated from recent highs, but from a historical perspective optimism remains elevated.
Optimism among individual investors, as reported by the AAII, has seen a more significant pullback, but more than half of survey respondents there acknowledge that their outlook is dominated by political views, not strictly opinions about the stock market. A move back toward the November sentiment lows could suggest optimism has been sufficiently unwound. This would mean a drop from 77% to 58% on the NAAIM Exposure Index and a decline in Advisory Services Bulls from 49% to 42%.
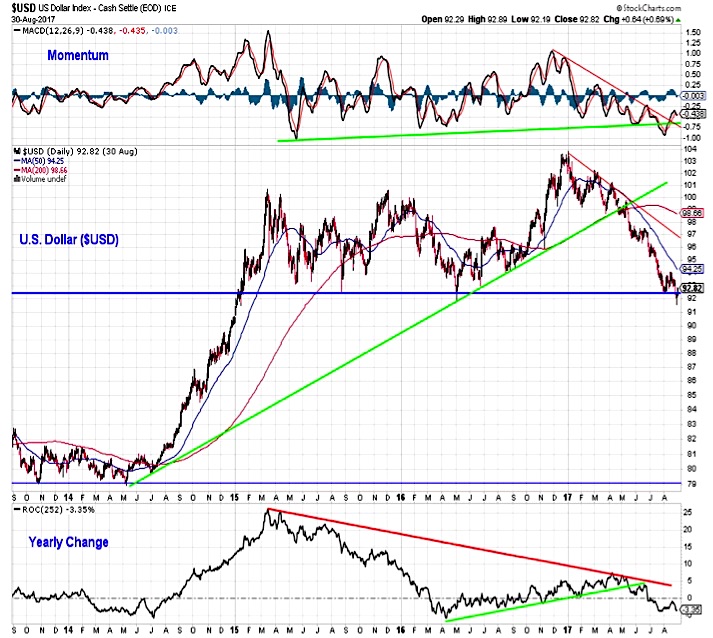
US Dollar Index
The breakdown in the dollar this week (and the improvement in Gold) has generated interest. While the initial reaction on the dollar may be that it was a false breakdown that will lead to a sharp reversal, there is not yet evidence of that. Rather, while the dollar is oversold and could bounce in the near term, both the price and momentum trends remain lower.
Twitter: @WillieDelwiche
Any opinions expressed herein are solely those of the author, and do not in any way represent the views or opinions of any other person or entity.


