Stock Market Futures Considerations For August 31, 2017
The S&P 500 Index (INDEXSP:.INX) is pointing higher again this morning as investors jump on the recovery rally. Traders will want to keep an eye on key trading levels, especially overhead price resistance. Key futures trading levels for today are provided below.
Check out today’s economic calendar with a full rundown of releases. And note that the charts below are from our premium service and shared exclusively with See It Market readers.
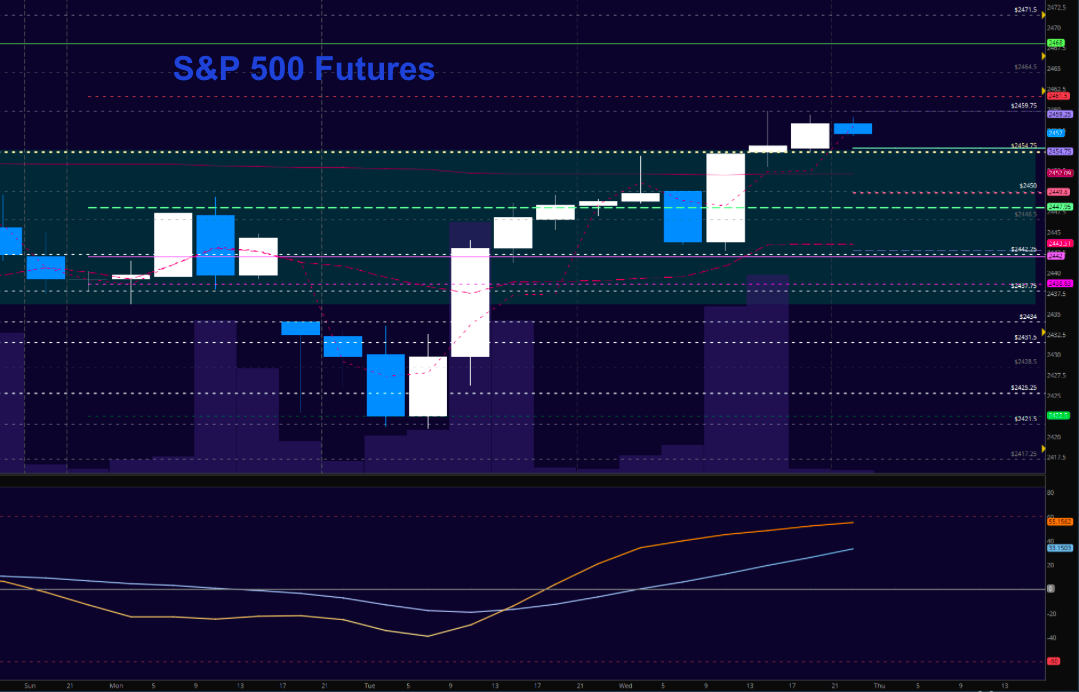
S&P 500 Futures (ES)
At this evening writing, formations hold as bullish with extensions into resistance reaching 2465 to 2468. Support action holds at 2451 to 2453. Should lower highs present here off of bounces into 2460, we should see tests of support lower. The bullets below represent the likely shift of trading momentum at the positive or failed retests at the levels noted.
- Buying pressure intradaywill likely strengthen above a positive retest of 2462
- Sellingpressure intraday will likely strengthen with a failed retest of 2451
- Resistance sits near 2460.5 to 2465.75, with 2468.75 and 2472.5 above that.
- Support holds between 2454 and 2451.5, with 2446.5 and 2441.5 below that.
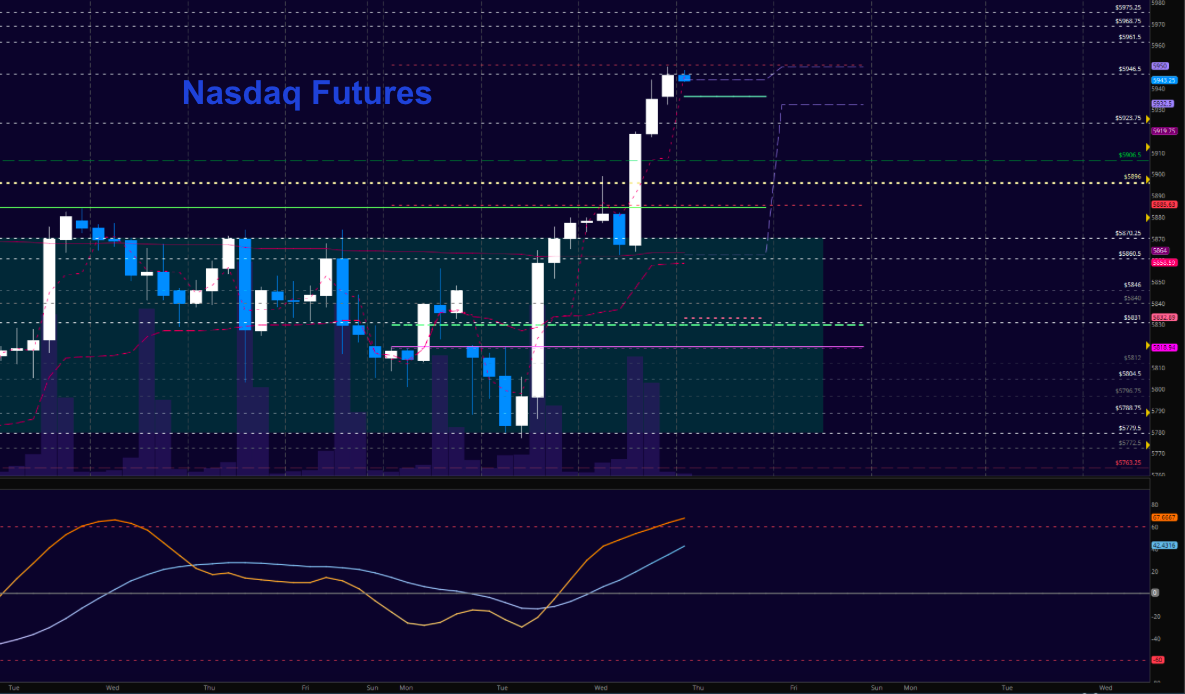
NASDAQ Futures (NQ)
Bullish formations hold as we head into the overnight sessions. Charts are extended however and should see reversal formations into higher support at the first pass. Formations say that pullbacks are buying zones for now but holding 5931.5 as support will be critical for this to carry on, else deeper support tests are on the horizon. The bullets below represent the likely shift of intraday trading momentum at the positive or failed tests at the levels noted.
- Buyingpressure intraday will likely strengthen with a positive retest of 5951.5
- Sellingpressure intraday will likely strengthen with a failed retest of 5924
- Resistance sits near 5946.75 to 5951.25, with 5961 and 5968.5 above that.
- Support holds between 5925.25 and 5916.5, with 5906.5 and 5897.5 below that.
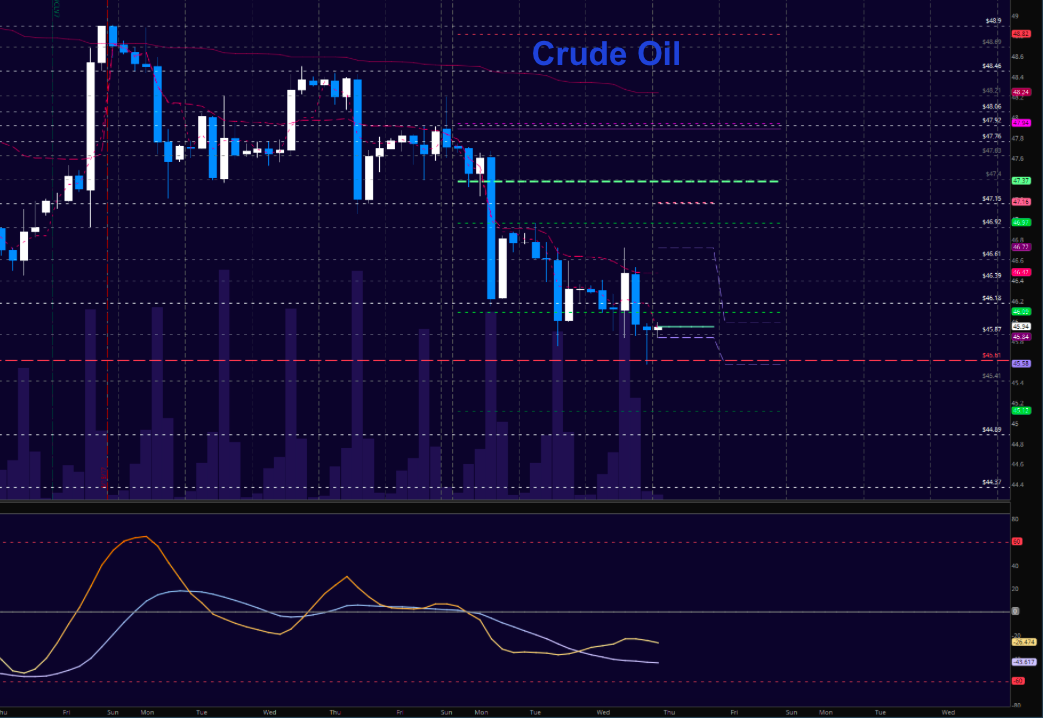
WTI Crude Oil
Charts hold the negative formations into deeper support. Should the chart lose 45.72, the chart will likely test lower levels near 45.4 and below. Momentum is slightly bearish and shifting but bounces are likely to find trapped buyers. The bullets below represent the likely shift of trading momentum at the positive or failed tests at the levels noted.
- Buying pressure intraday will likely strengthen with a positive retest of 46.94
- Selling pressure intraday will strengthen with a failed retest of 45.7
- Resistance sits near 46.8 to 47.24, with 47.4 and 47.78 above that.
- Support holds between 45.9 to 45.61, with 45.4 and 45.2 below that.
If you’re interested in the live trading room, it is now primarily stock market futures content, though we do track heavily traded stocks and their likely daily trajectories as well – we begin at 9am with a morning report and likely chart movements along with trade setups for the day.
As long as the trader keeps himself aware of support and resistance levels, risk can be very adequately managed to play in either direction as bottom picking remains a behavior pattern that is developing with value buyers and speculative traders.
Twitter: @AnneMarieTrades
The author trades stock market futures every day and may have a position in mentioned securities at the time of publication. Any opinions expressed herein are solely those of the author, and do not in any way represent the views or opinions of any other person or entity.


