Gold Futures Trading Update: Oversold Bounce Or More?
Gold futures have been sliding alongside global stock markets.
This highlights how this past week has acted more like a sell everything panic.
After slipping through...
Will Crude Oil Reversal Add Fuel to Stock Market Rally?
Crude Oil prices have been volatile the past year, swinging between $50 and $65 like a ping pong ball.
But the movement in oil prices...
Gold Bulls Hope the Euro Holds Long-Term Trend Line!
Currencies play an important role with precious metals.
Gold and Silver either have the tailwind of a weak US Dollar or the headwind of a...
Crude Oil Bearish Price Reversal Lower: It’s the 61.8 Fib Again!
Earlier this month, we wondered if January would mark a top for Crude Oil and stocks?
Well, crude oil appears to have topped... and from...
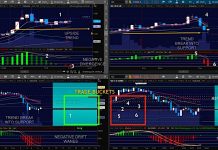
Coach’s Corner: Are You Aiming for the Right Bucket?
Do you know how to quickly assess the probability of price follow-through?
Here's my favorite way to do this.
When we are live trading together in...
One Chart: Commodities (and why investors should pay attention)
The one question I pose to all of my interviewees and fellow investors is ‘if you had one chart, other than the S&P500’, that...
Top 10 Investment Charts For This Year (2020)
I spent a lot of time in the 2019 End of Year Special Edition looking back and reflecting across the year just been, covering some of my best (and worst) charts...
Look for a Natural Gas Price Bottom In Early 2020
Our forecast for the United States Natural Gas Fund ETF NYSEARCA: UNG that we described in our September 11 post did not get an adequate...
Gold Breakout or Fakeout? Bulls Need Support To Hold!
Gold Futures Price Chart - Breakout or Fakeout?
Gold spike higher on U.S.-Iran tensions quickly reversed back lower...
Will support hold?
Gold bulls certainly hope so. ...
Stock Market Indices Lose ‘3 Green Arrows’ Signal
The S&P 500 Index INDEXSP: INX fell 0.28% today, but retains its bullish intermediate posture according to the Market Forecast indicator.
All major U.S. stock market indices...


