The one question I pose to all of my interviewees and fellow investors is ‘if you had one chart, other than the S&P500’, that you feel gives you a good read on the markets what would it be?’
Today, I am sharing with you my One Chart, which is the chart of Commodities, or the GSCI Commodity Index Trust (GSG). It is sort of like the CRB of the Bloomberg Commodity Index.
There are a number of different ways you can measure commodity performance overall and the stock chart I like to use is the GSG.
What is interesting about this chart of commodities is that you have this rotation from distribution to consolidation to accumulation, in sort of phases.
Note that you can see a more in-depth video on the on my YouTube channel.
$GSG – GSCI Commodity Index Trust ETF
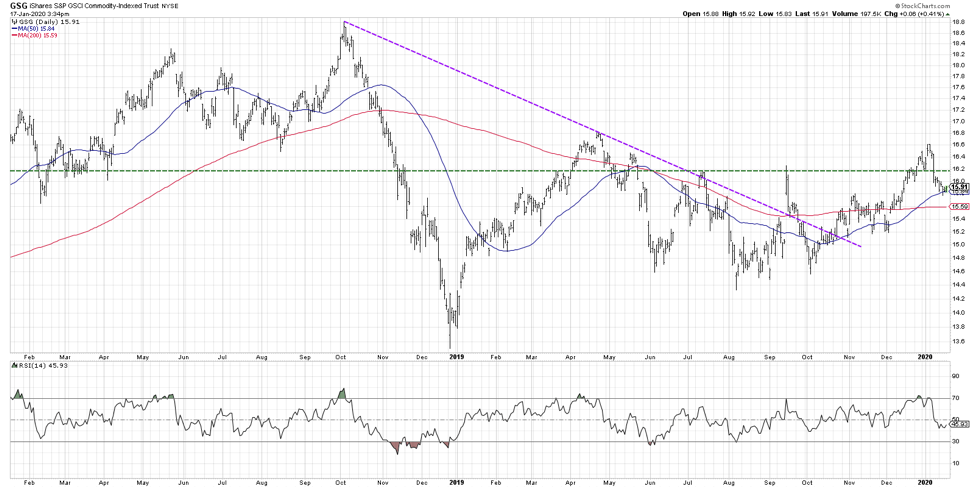
It accelerated in the fourth quarter of 2018 and reversed in the first quarter of 2019, but then we settled into a downtrend using the high from October 2018 and connecting that in April of 2019. It was tested a number of times and had a false break in September 2019 but finally broke through in October 2019.
Going from mid-2019 to where were at now in January 2020, it looks like a big basing pattern, there is a range between roughly 14.60-16.20. Now, crossing into 2020 and in the past few weeks of 2019 what we are seeing is finally a rotation to the upside, breaking out of that range.
If you use the traditional measurement technique by taking the height of the base (about 14.60 to 16.20) it gives you an upside objective around the congestion range you had back in 2018. This seems to be a symmetrical measurement based on the breakout that we have seen.
The reason that this is my one chart is though in the last several days we have seen a severe pullback. The chart of gold and oil are all coming down with the news with US and Iran.
Focusing just on the charts, the price has pushed back into that range and I believe one of two things is going to happen. Either:
- We will resume the uptrend with a bit of pullback, a pause that refreshes before we push higher and break meaningfully out of this range.
OR
- We settle back into this range bound environment.
Whatever happens there has implications for emerging markets vs. developed markets for a lot of stocks and industries that are tied to the commodity complex.
I think we are at a really important junction because the breakout has sort of broken and we have come back into that range. Will we see a continuation or not?
My assumption is that we will see a resumption of the uptrend. I am guessing we will pull back in, consolidate, and go higher.
The way that I would confirm that is the case is by looking at the RSI at the bottom. In a bullish phase, the RSI tends to find a bottom around 40, does not go meaningfully below there, and then resumes higher. On the pull back that is what I would be looking for, whether or not it breaks below that key 40-level.
Twitter: @DKellerCMT
The author does not have a position in mentioned securities at the time of publication. Any opinions expressed herein are solely those of the author, and do not in any way represent the views or opinions of any other person or entity.

: Showing Some Signs of Emerging Strength")
