Earlier this month, we wondered if January would mark a top for Crude Oil and stocks?
Well, crude oil appears to have topped… and from a familiar place!
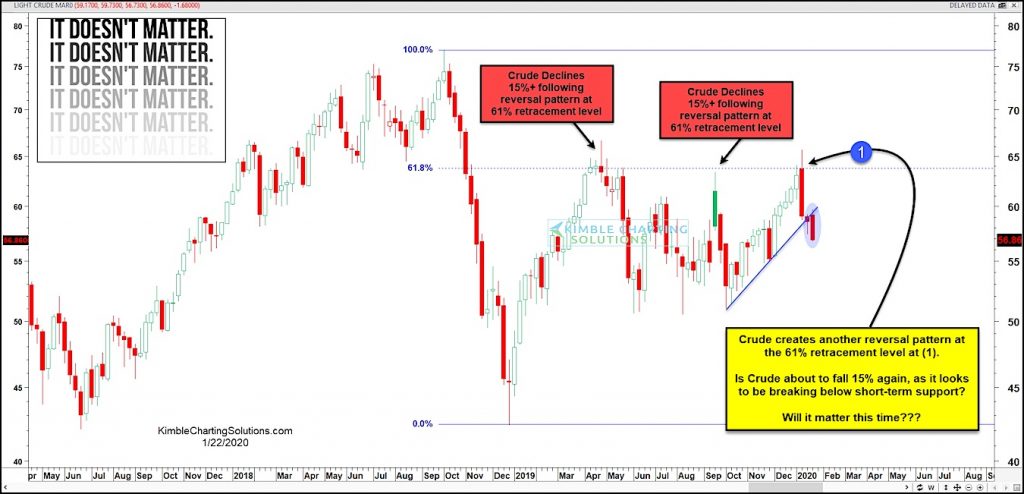
In today’s chart, we highlight a key price resistance level that has stopped Crude Oil rallies, while producing some bearish reversal patterns and ugly selloffs: The 61.8 Fibonacci retracement level.
And it appears that Crude Oil is repeating this pattern again from the same Fib level.
As you can see in the chart below, it is becoming more difficult to say, “it doesn’t matter.”
And considering that Crude Oil broke its up-trend line this week, Oil bulls should be concerned that it definitely does matter! Stay tuned!
Crude Oil “weekly” Price Chart
Note that KimbleCharting is offering a 2 week Free trial to See It Market readers. Just send me an email to services@kimblechartingsolutions.com for details to get set up.
Twitter: @KimbleCharting
Any opinions expressed herein are solely those of the author, and do not in any way represent the views or opinions of any other person or entity.


