It’s a good idea for investors to be aware of key indicators and inter-market relationships.
Perhaps it’s watching the US Dollar as an indicator for precious metals or emerging markets. Or watching interest rates for the economy. Experience, history, and relationships matter. And it’s good to simply add these to our tool-kit.
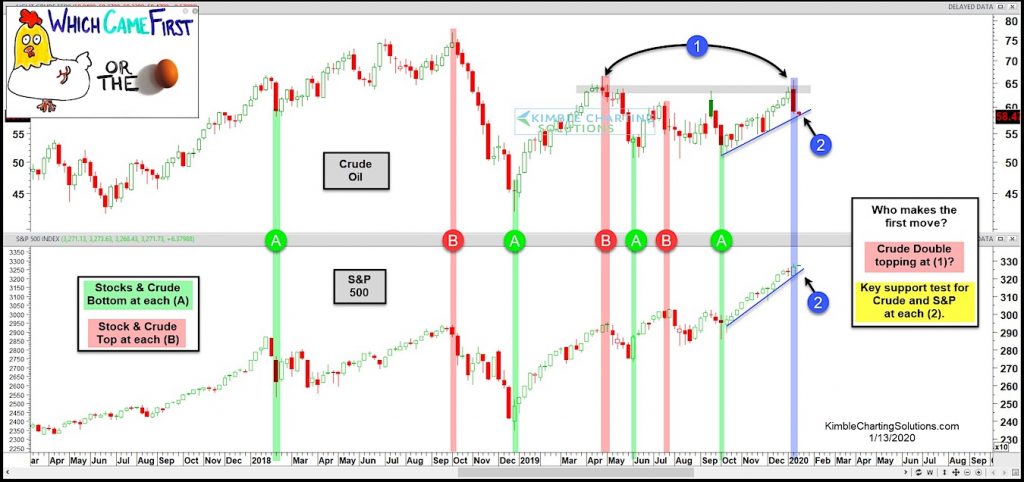
Today, we look at another relationship that has signaled several stock market tops and bottoms over the years, and especially the past several months.
Crude oil versus the S&P 500 Index (stock market)
When crude oil tops or bottoms, it seems that the stock market follows along. And with Crude oil reversing lower last week, it’s probably a good idea that investors pay attention here.
Looks like an important test for crude oil and stocks could be in play at each trend line (2). Stay tuned!
Crude Oil vs S&P 500 “weekly” Chart – Topping Together?
Note that KimbleCharting is offering a 2 week Free trial to See It Market readers. Just send me an email to services@kimblechartingsolutions.com for details to get set up.
Twitter: @KimbleCharting
Any opinions expressed herein are solely those of the author, and do not in any way represent the views or opinions of any other person or entity.
: Cup (and Maybe Handle) Watch")
 Trading Near Top Of Price Range")
 Reaches Important Price Support")