Our forecast for the United States Natural Gas Fund ETF NYSEARCA: UNG that we described in our September 11 post did not get an adequate confirmation signal, and our bullish expectations turned out to be premature.
We are still looking for a durable low, but the summer price spike was unable to overcome the resistance levels we mentioned previously.
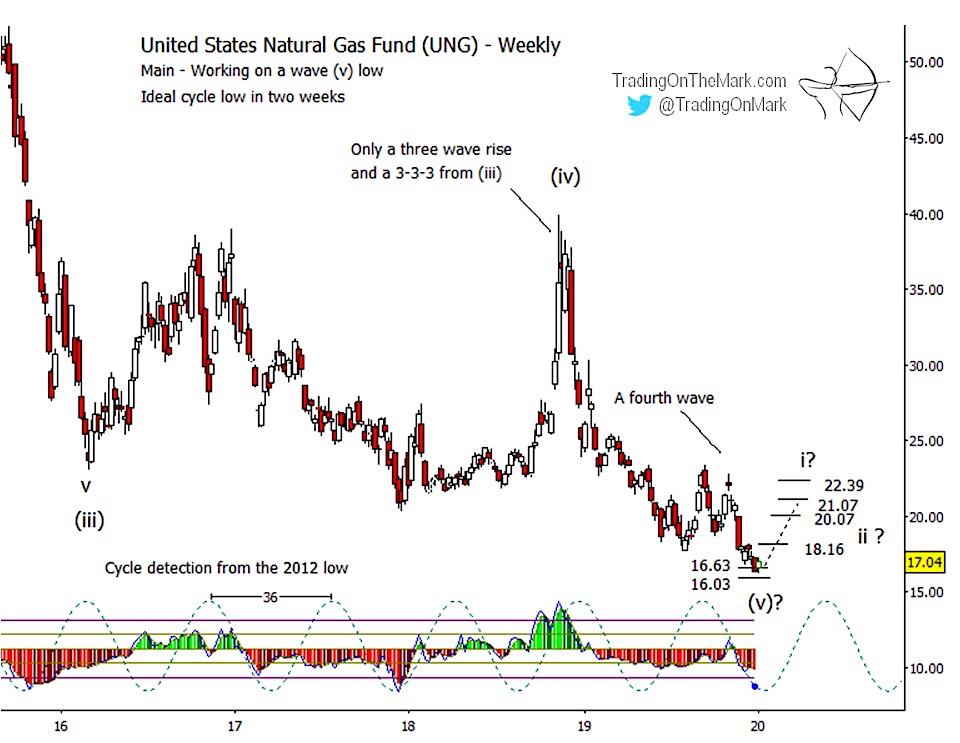
Today we revisit the case for a low in UNG forming soon. There is timing and support to watch, and we are monitoring the formation of what should be a downward wave ‘v’ of (v).
The support zone near 16.63 and 16.03 is based on a Fibonacci-related technique, and it will probably be felt by the market. Note also that the empirical 36-week price cycle will have an inflection during the week of January 20-24.
Recall that the support at 18.10 which we emphasized in our August 4 post produced a strong bounce starting soon after publication. In hindsight that bounce appears to have been the beginning of a corrective fourth wave in the ongoing downward impulse instead of being a first-wave upward reversal.
UNG proceeded to poke slightly above the resistance zone we had identified in September as being near 21.81 and 22.89, but it was unable to form a weekly close above 22.89.
The remaining question then is whether the decline from the wave ‘iv’ peak in September has formed a complete five-wave structure. On a daily chart of natural gas futures (available to subscribers), it is possible to count five waves down into an important support level, and there is additional timing nearby.
Our experience with forecasting the bounce in the previous newsletter emphasizes how important it is to use good trade management practices. The support we mentioned in September worked well for an entry, and the first resistance targets were tested. That could have made for a decent trade, but UNG’s failure to make a confirming close above resistance should have alerted bullish traders to raise stops or take profits.
Similar considerations might apply in the current situation. If a bounce starts from near the supports marked at 16.63 and 16.03, then the first upward target should be modestly higher at 18.16. A weekly close above that level opens the door to 20.07, 21.07 and possibly 22.39. A close above 21.07 would suggest that a new pattern is starting to form, as it would already be overlapping what we believe was downward wave [i] of ‘v’ of (v).
A Daily Analysis subscription at TOTM gives you constant access to up-to-date with charts on weekly and daily time frames for the Euro, the Dollar Index, gold, crude oil, bonds and the S&P 500. Intraday Analysis offers additional moment-by-moment coverage. Learn more at Trading On The Mark.
Twitter: @TradingOnMark
The authors may have a position in the mentioned securities at the time of publication. Any opinions expressed herein are solely those of the author, and do not in any way represent the views or opinions of any other person or entity.


