This is a quick update for readers at See It Market to show how our natural gas forecast is holding up. It’s working well after the recent natural gas price reversal higher.
But let’s recap first before discussing the current bullish Elliott wave setup.
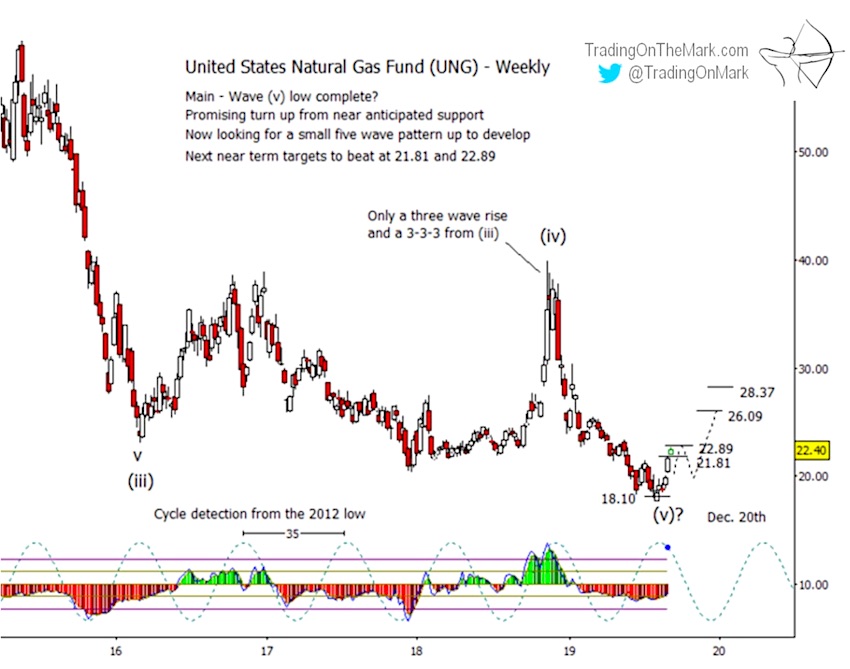
In early August we used a chart of the United States Natural Gas Fund (symbol UNG) to show why a low might be close at hand and why nat gas could be a good long-term buy.
We described a five-wave impulsive count down from the November 2018 high, and we indicated that the pattern appeared to be nearing completion. The main support we showed for UNG was at 18.10.
Natural gas UP-date: Bulls Advancing
Soon after our post, Natural Gas prices and ETF (UNG) poked slightly beneath support for a few hours before recovering. This natural gas price reversal sends a bullish confirmation to our chart analysis.
Now UNG has reached the price resistance area we defined earlier (21.81 to 22.89) whose failure could provide initial confirmation of an upward reversal.
So far, price movement is behaving as though the low in early August was a reversal point. Note how that also coincided with an inflection in the 35-week cycle that has been operating since 2012. It also fits with an inflection of the 64-week cycle that we showed on the chart in our earlier email.
It is reasonable to think the resistance at 22.89 might allow for a small downward retrace. Bulls will view that retrace as a buying opportunity.
There’s considerably more information on a daily chart to support trading decisions right now. A faster price cycle, geometry, and more finely tuned resistance/support levels highlight certain areas as good entry points.
A Daily Analysis subscription at TOTM gives you constant access to up-to-date with charts on weekly and daily time frames for the Euro, the Dollar Index, gold, crude oil, bonds and the S&P 500. Intraday Analysis offers additional moment-by-moment coverage.
Did you know that every month we select one recipient of our free newsletter to win a four-week access package to our premium subscription service? The newsletter brings you even more charts and in-depth analysis to help with your trading. Request your free newsletters here!
Twitter: @TradingOnMark
The authors may have a position in the mentioned securities at the time of publication. Any opinions expressed herein are solely those of the author, and do not in any way represent the views or opinions of any other person or entity.


