There are several reasons to think UNG might be reaching the end of it’s decade-long decline. Let’s start with the Elliott wave count.
In the big picture – too big to fit on the weekly chart shown here – we’ve been monitoring the multi-year decline in UNG.
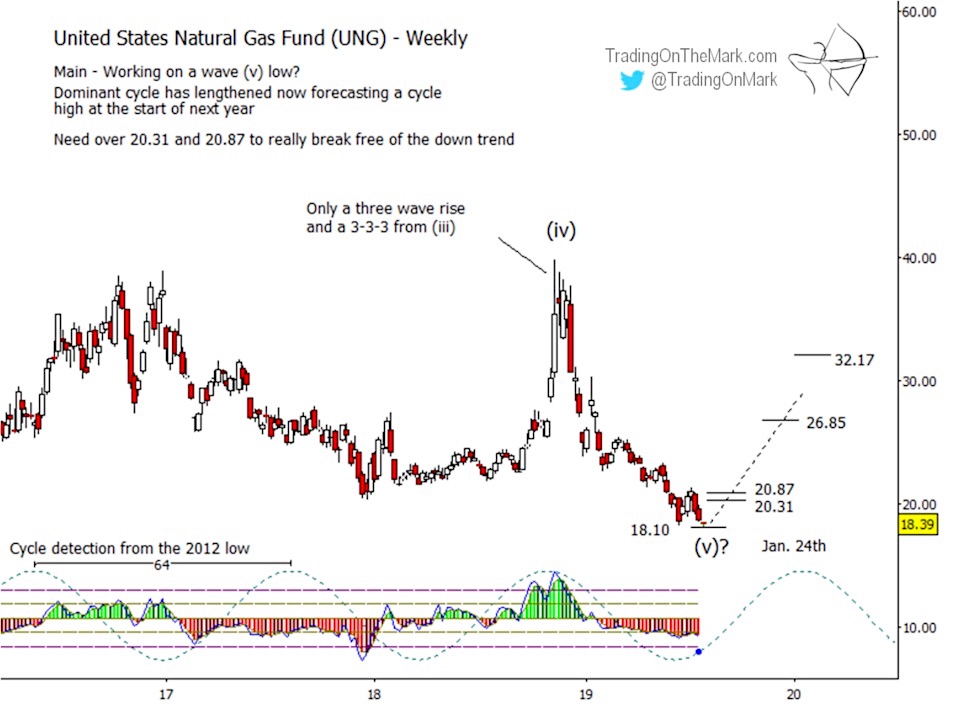
In that formation, the high in November 2018 counts well as the completion of upward/corrective wave (iv), and we hope to see a smaller five-wave move down from there.
The decline from November 2018 also looks impulsive on a smaller scale, as it should. Price is currently testing support near 18.10, which is in the right zone to watch for a bounce or reversal.
The dominant 64-week cycle is just now coming off a low too, and there might even be a small positive divergence showing on the adaptive CCI momentum indicator shown on the chart.
We will know if the divergence is real at the end of the week.
There are also signs of a looming reversal on a daily chart, available as part of our regular service. The count downward from wave (iv) looks well structured, and there are some additional support levels to watch in the current vicinity.
It would probably require a weekly close above the 20.31-20.87 zone to get bears to cover and help push a reversal. If that gets started, then preliminary resistance areas to overcome include 26.85 and 32.17, which would represent a very substantial advance for this volatile fund.
This summer is a great time to give TOTM a try, and there’s even an opportunity to lock in a deep 20% savings on a 12-month subscription. The coupon code is FROSTY. (Readers of our free newsletter know about a code that gets them 25% off.)
A Daily Analysis subscription at TOTM gives you constant access to up-to-date with charts on weekly and daily time frames for the Euro, the Dollar Index, gold, crude oil, bonds and the S&P 500.
Intraday Analysis offers additional moment-by-moment coverage of the S&P 500, ES futures, and related markets along with more detailed charts for the other instruments. The Intraday forum is also a good place to ask questions and learn how other traders approach the market.
Twitter: @TradingOnMark
The authors may have a position in the mentioned securities at the time of publication. Any opinions expressed herein are solely those of the author, and do not in any way represent the views or opinions of any other person or entity.

: Worrisome to Broader Market?")
