Do you know how to quickly assess the probability of price follow-through?
Here’s my favorite way to do this.
When we are live trading together in the trading room, we often are looking at so much at the same time that we lose the bubble on the most important things – so I have the following graphic below and from there we will fill our ‘TRADE BUCKETS’ for the appropriate trade for follow-through.
We are going to step through the OODA loop with our executions
Please note that assessing the likely follow-through of trend or near term trading direction does not imply that we execute at the price point that is printing.
Determining follow-through is your first step – observe. This is what we are doing here first.
We only need two of the four timeframes to assess what we are to do; you can choose any two of them.
The faster the time frames you use, the shorter the time of the trade will be.
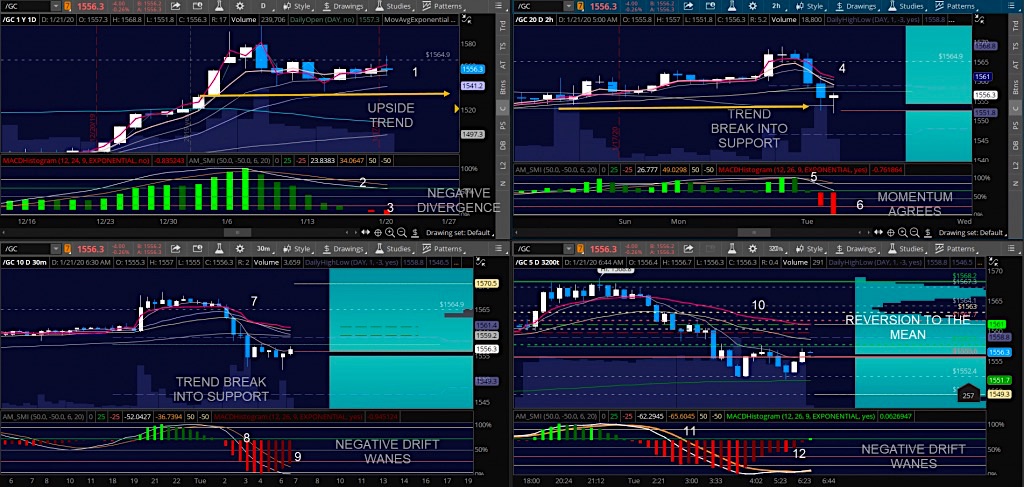
Note that all charts are of the current Gold Futures contract from this morning (Tuesday January 21).
Let us consider the numbers 1-6
Setting this up for yourself, you can use three momentum/trend indicators.
I use two tight moving averages (I use the 5ema and the 10ema much of the time), and one larger one – (like the 50 or 100 simple moving average or exponential moving average).
For momentum, I use the Stochastic Momentum Index (6, 20) and the MACD (12, 26, 9) or whatever you choose. The beauty of this is that you can choose settings you are comfortable with if you already use these indicators.
Note, the following image where I am using the two larger time frames to create my frame of reference. This is the ‘orient’ phase of our OODA loop
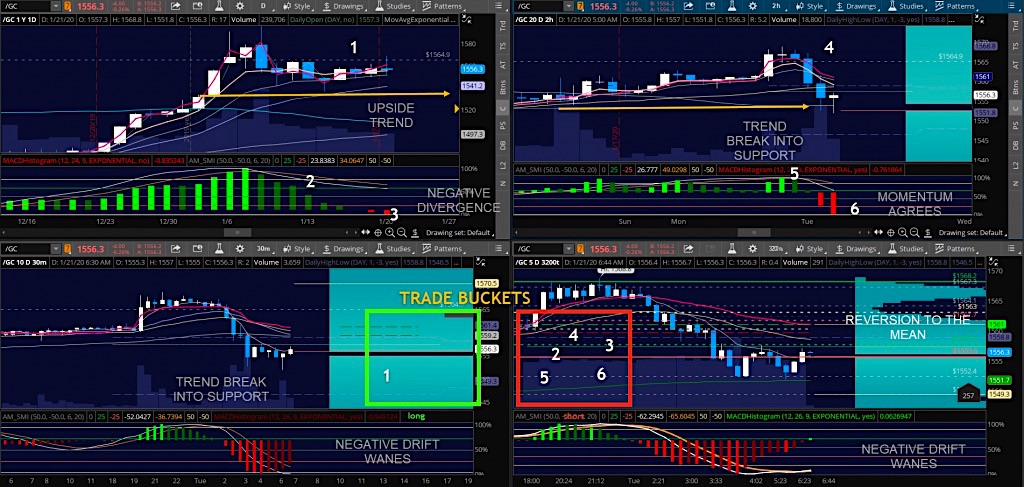
Our Trade Buckets
Here’s how we put observations in the buckets – we are assessing the larger time frames –
- The (1) noted shows upward trending moving averages that have gone sideways but holding a clear level of support. This gives the overall motion of the chart as bullish as it has not broken key support. This is why the (1) sits in the ‘long’ trade bucket.
- The (2) and (3) noted show the SMI in a crossover and the MACD as negative. This is why the (2) and (3) sit in the ‘short’ trade bucket
- The (4) noted shows downward moving averages with the candles printing beneath the moving averages and making lower highs and lower lows. This puts (4) in the ‘short’ trade bucket.
- The (5) and (6) noted show the SMI and MACD as negative. This is why the (5) and (6) sit in the ‘short’ trade bucket
Now the quick assessment – where are most of the numbers located in the buckets – in the long or the short? The short….. BUT this does not tell us that we can go short here without an increased level of risk. Why?
Because we are close to a key level of support – note the daily time frame and all the congestion. So the trade setup using these two timeframes says to wait for the test of resistance near 1563 for the best short with a 2-3 point stop with two potential targets – one at 1553 and one at 1532 – this is likely to be a swing trade setup. Note, if the price fails to lose 1541 where key support sits, this trade will yield less return and is likely to take several hours to develop. This is our ‘decide’ phase of our OODA loop
Now, let’s consider the two smaller time frames and do the same thing.
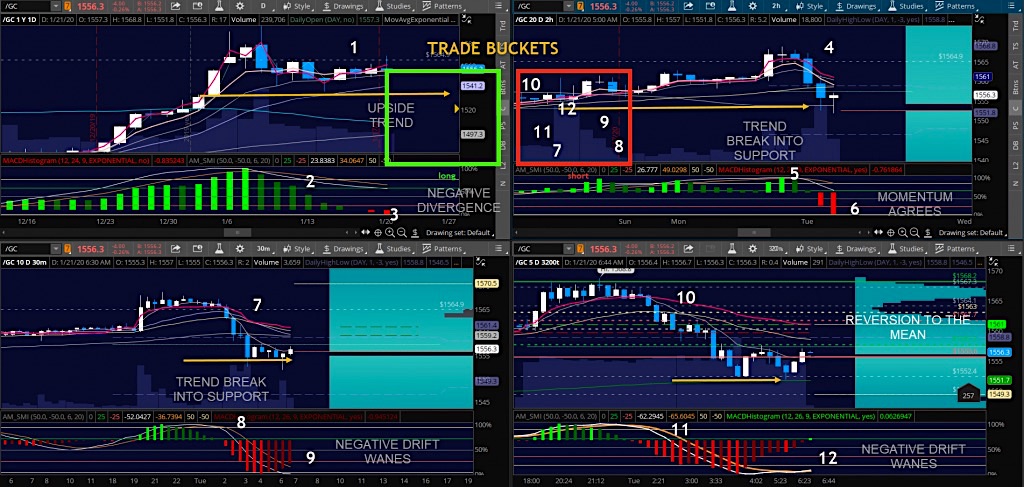
Assessing Future Probable Motion
Note now that all our observations are in the ‘short’ bucket. This means that our likely bounce will test resistance and meet significant trouble on the shorter timeline.
So on our shorter cycle, we can engage at the failed test of 1558-1560 with a two-point stop and targets at 1556 first and then 1552 with potential continuation into support of 1541 and then some. Notice that because these observations are on very tight cycles of time, you may have to exit much more quickly if trend and momentum shift out of your favor and end up in another bucket.
This could be contrary to our usual thought process which tells us that we must be staging a bullish trade but the time for the long trade at this juncture of price has passed and uses a different mechanic (the bottom or top picker)- which we will cover another day in the Coach’s Corner.
Use visual cues first and then set up your trades based on the likelihood of continuation of the trend/timeframe is very often the most forgiving of mechanics.
Key elements we will continue on with are – how do we choose the execution event once we see the ‘trade buckets’ and how we keep from running off the rails if the charts changes direction quickly will all be part of future Coach’s Corner events.
Learn more about my services over at The Trading Book site.
Twitter: @AnneMarieTrades
The author trades stock market futures every day and may have a position in mentioned securities at the time of publication. Any opinions expressed herein are solely those of the author, and do not in any way represent the views or opinions of any other person or entity.


