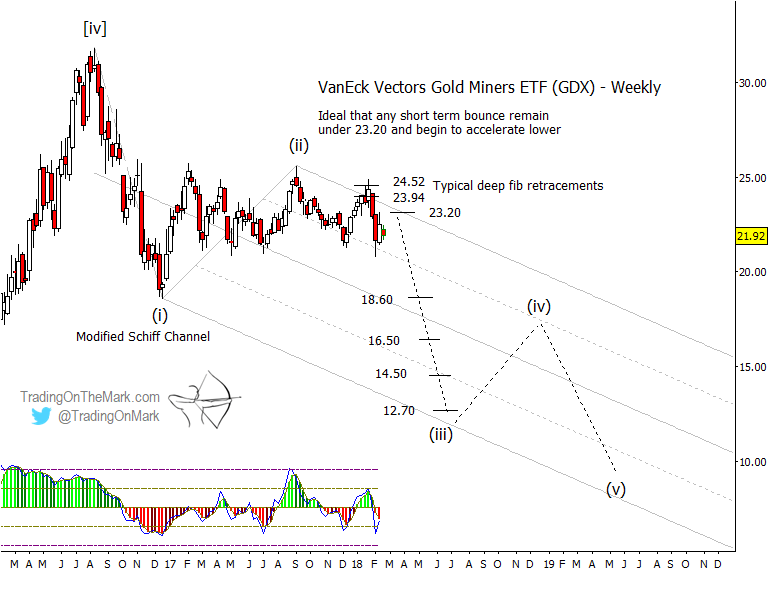
Gold Miners (GDX) Elliott Wave Forecast Points Lower Yet
In December, we highlighted a potential trade developing in the VanEck Vectors Gold Miners ETF (NYSE Arca: GDX). Since that article was posted, we...
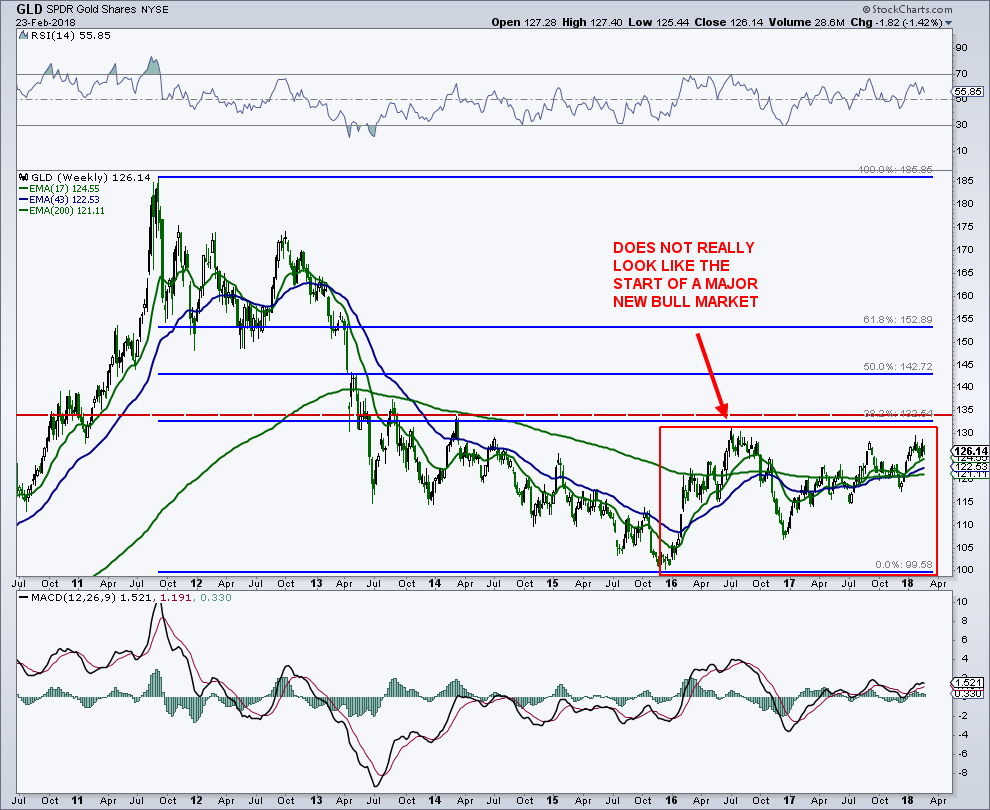
New Gold Bull Market Starting? Not So Fast…
Today, I want to provide a quick update on gold trading and the iShares Gold Trust (GLD). Gold has been meandering beneath major price...
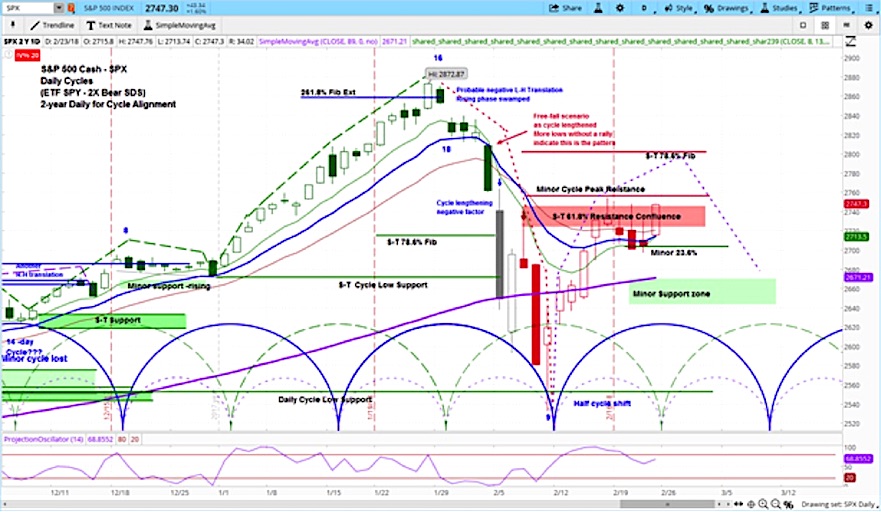
Market Outlook: Stocks Set To Continue Bounce, Then Fail
The S&P 500 reversed course on Friday and rallied back to new 3-week closing highs.
Look for stocks to extend gains into this week before...
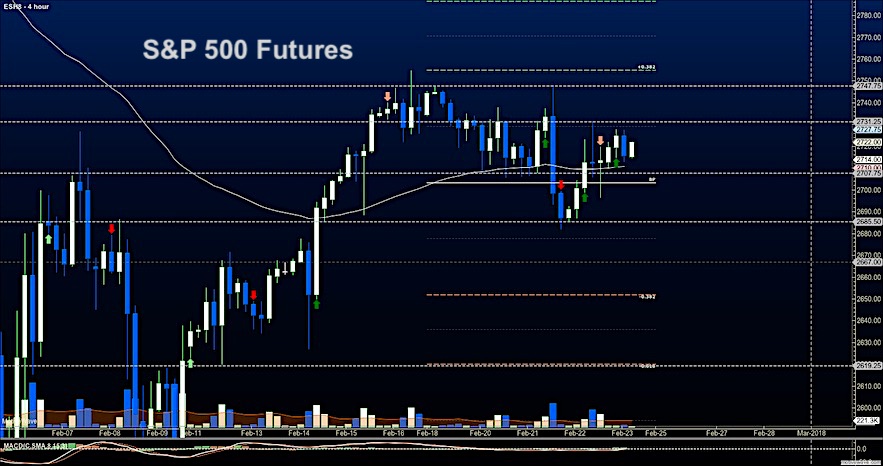
Stock Market Futures Trading Outlook: A Big Break Is Coming
Stock Market Futures Outlook for February 23, 2018
Diminishing directional moves continue as the current price range compresses on the S&P 500. Traders should expect a...
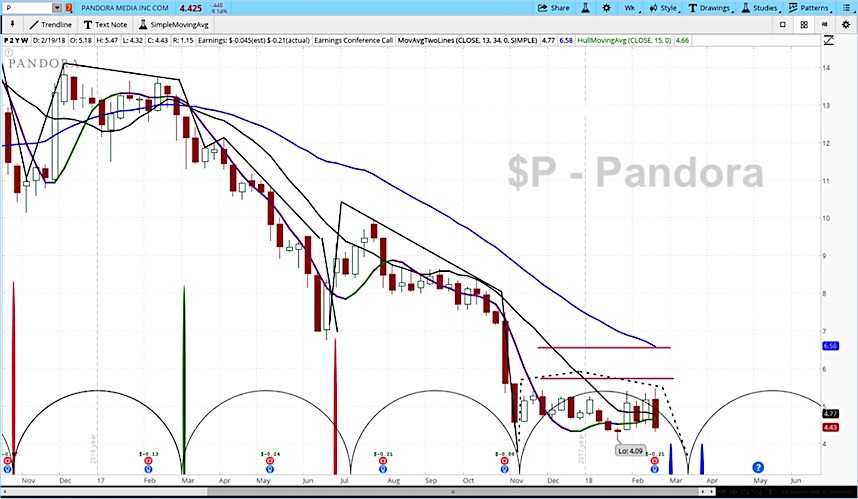
Pandora (P) Earnings Reversal: Stock Pops Then Drops Sharply
Shares of Pandora Internet Radio (P) initially popped 11% to $5.42 yesterday when the company reported an increase in subscription revenue of 63% as...
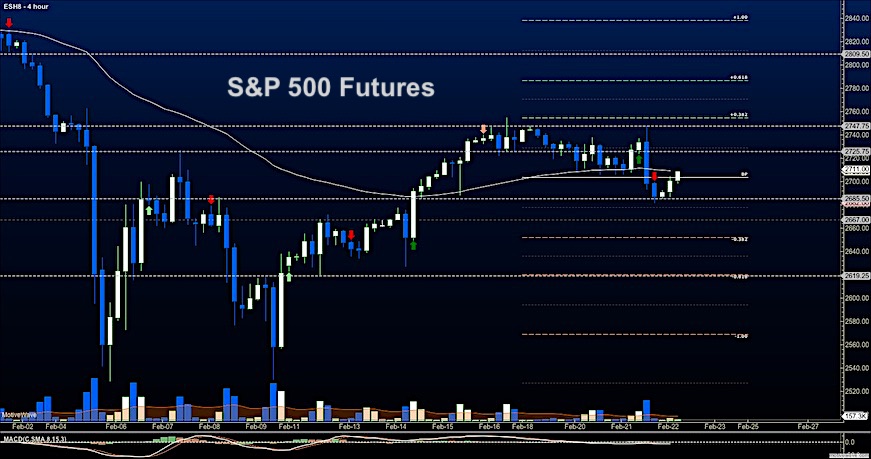
S&P 500 Futures Update & Trading Outlook: Eyes On 2705
Broad Stock Market Outlook for February 22, 2018
Price resistance stood tall yesterday and rejected the bulls advance. This lead to a very swift move to...
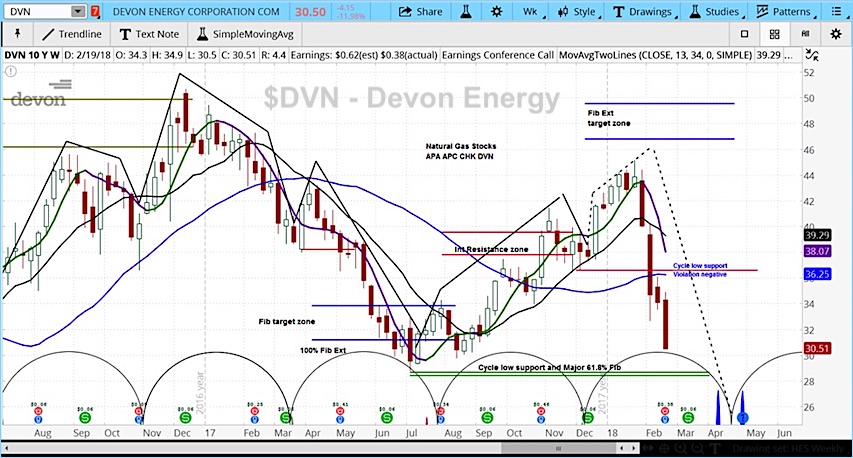
Devon Energy (DVN) Misses Earnings, Sinks Past Cycle Low
Devon Energy (DVN) dropped by as much as 11% on Wednesday morning after missing Wall Street’s estimates for earnings.
The company reported earnings per share...
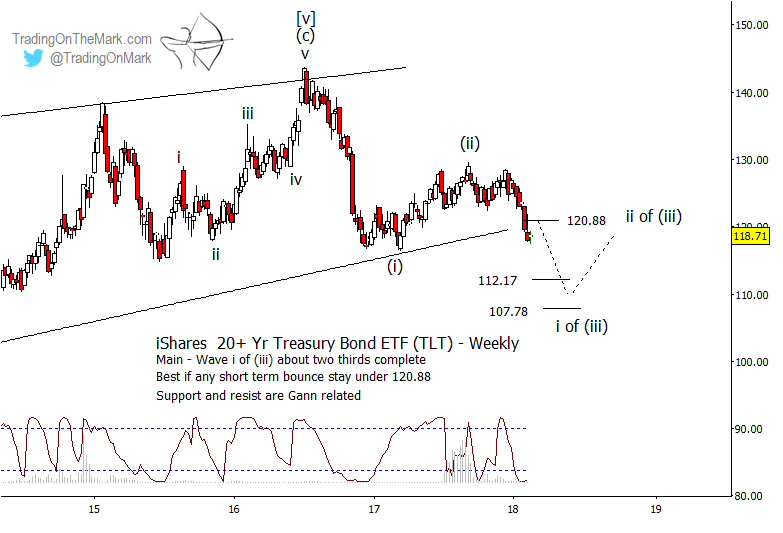
Riding The Downward Trend In US Treasuries
Our Elliott wave forecast for treasury bonds continues to hold up well. In June 2017 we described the minor rally during the first part...
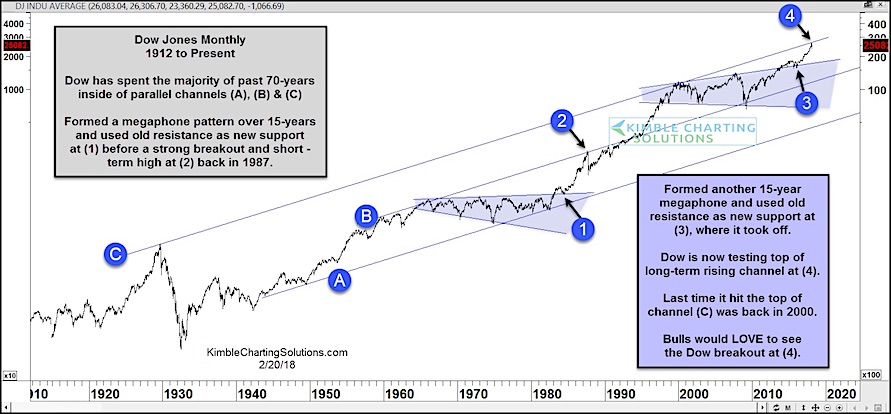
Dow Industrials “Megaphone” Pattern Leads To Major Test!
Back in November, I shared a long-term historical chart of the Dow Jones Industrial Average and pointed out a megaphone pattern breakout that looked...
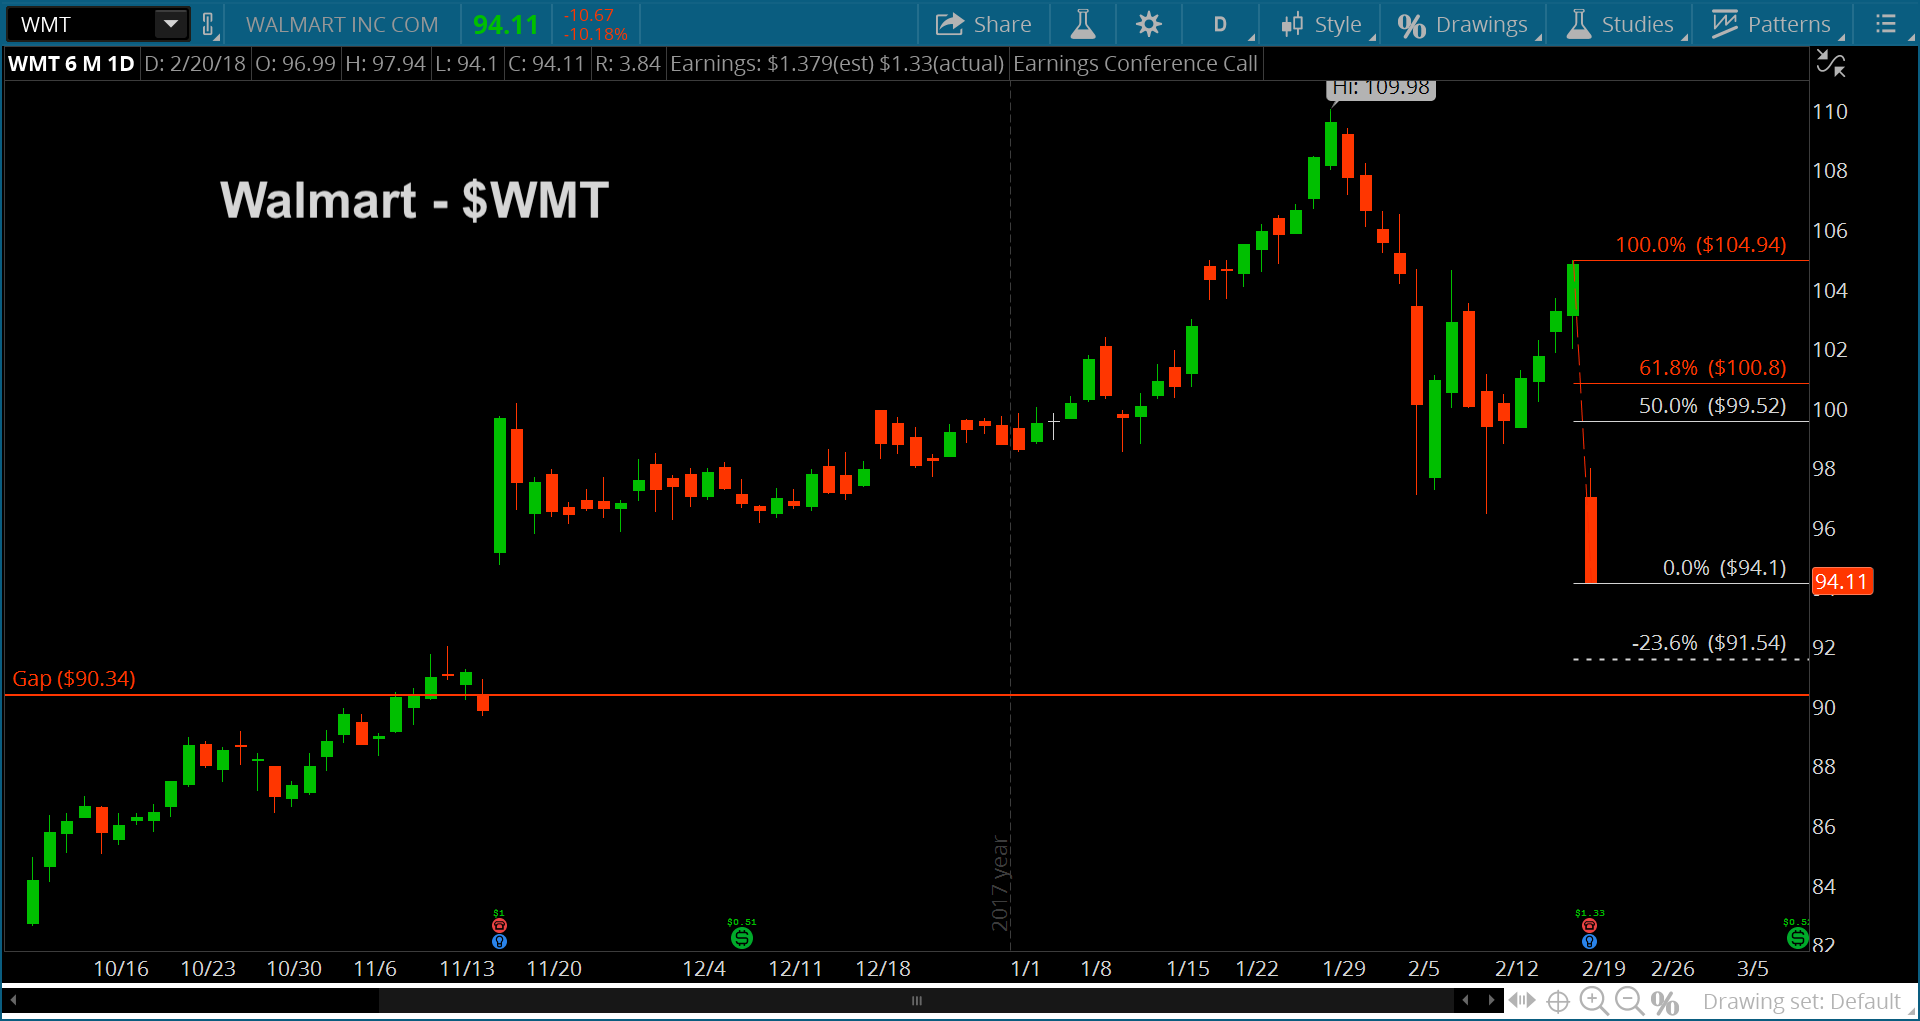
Walmart Stock (WMT) Declines Toward $90 Price Target
Walmart's online sales growth appears to be slipping and that has been a catalyst in sending the stock price lower.
But as I often say,...

