
Will US Dollar Weakness Be Bullish For Precious Metals?
A couple weeks ago, we highlighted the U.S. Dollar as an asset that was ready for a big move.
King Dollar was trading sideways and...
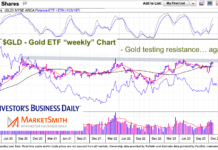
Gold Testing Breakout Price Resistance… 3 Times A Charm?
Gold prices have made a strong reversal to the upside... and it came out of a quick downturn (catching traders leaning the wrong way).
Could...

Silver Price Has Bullish Opportunities On Geopolitical Issues
Metals are experiencing an upward trend this week due to geopolitical tensions between Israel and Hamas. During times of uncertainty, investors tend to favor...
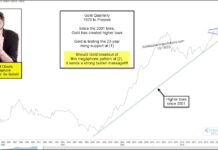
Gold Price Pattern Could Lead To Super Bullish Breakout!
The price of gold has traded sideways for the past three years. Feels boring (and the pullbacks painful) for bulls.
But all this boring action...
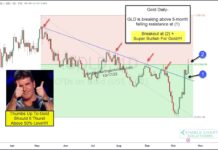
Gold Prices Clear Downtrend, Important Breakout Next?
Gold prices have bounced around during a volatile multi-month pullback. Each rally has been met with more selling.
Could that be changing soon?
Today's "daily" chart...
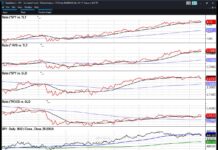
3 Key Relationships to Help Assess Stock Market Direction
If you are finding yourself fluctuating between bullishness and bearishness, then congratulations!
Hopefully, that also means you are waiting for certain signals to help you...

U.S. Dollar Double Top? Precious Metals Sure Hope So!
When the U.S. Dollar is rallying and at full strength, it is a clear headwind for precious metals like gold and silver.
But when King...
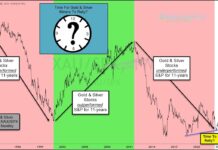
Is 11-Year Cycle Signaling Gold and Silver Miners Rally?
The price of gold is trading just off its all-time highs while the price of silver is lagging. Together, they haven't quite provided mining...
History Rhymes: 1974-1976 vs. 2022-2024?
How many of you have heard me say that commodities are inherently volatile?
Clearly, from this chart you can see that after the oil rally...
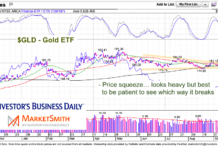
Gold ETF (GLD): Narrowing Price Pattern Indicates Bigger Move Coming
Not even rising inflation, a debt ceiling fight, nor a raging war overseas seems to move gold prices.
But either way, when looking at the...