The price of gold has traded sideways for the past three years. Feels boring (and the pullbacks painful) for bulls.
But all this boring action could be coming to an end… with a bang!
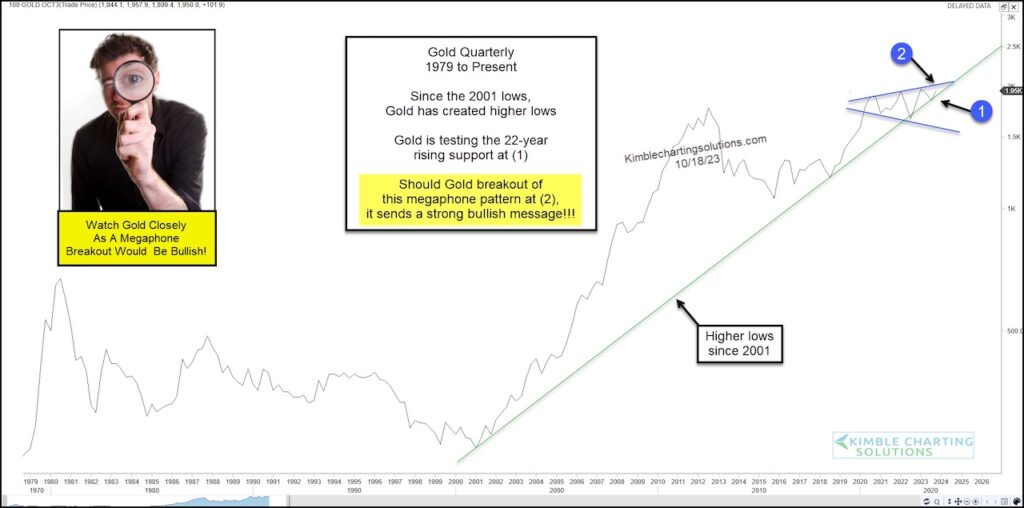
Today’s long-term “quarterly” line chart highlights a potentially bullish pattern.
First, gold has continued to bounce off its 22-year rising trend support line at (1). And second, a megaphone pattern at (2) shows price getting squeezed between the upper megaphone resistance and rising trend line support.
So we have another key price support test in play at (1). Bulls need this to hold.
And should Gold breakout at (2), it would be super bullish! Stay tuned!
Gold Price “quarterly” Line Chart
Note that KimbleCharting is offering a 2 week Free trial to See It Market readers. Just send me an email to services@kimblechartingsolutions.com for details to get set up.
Twitter: @KimbleCharting
Any opinions expressed herein are solely those of the author, and do not in any way represent the views or opinions of any other person or entity.

: Worrisome to Broader Market?")
