Gold prices have bounced around during a volatile multi-month pullback. Each rally has been met with more selling.
Could that be changing soon?
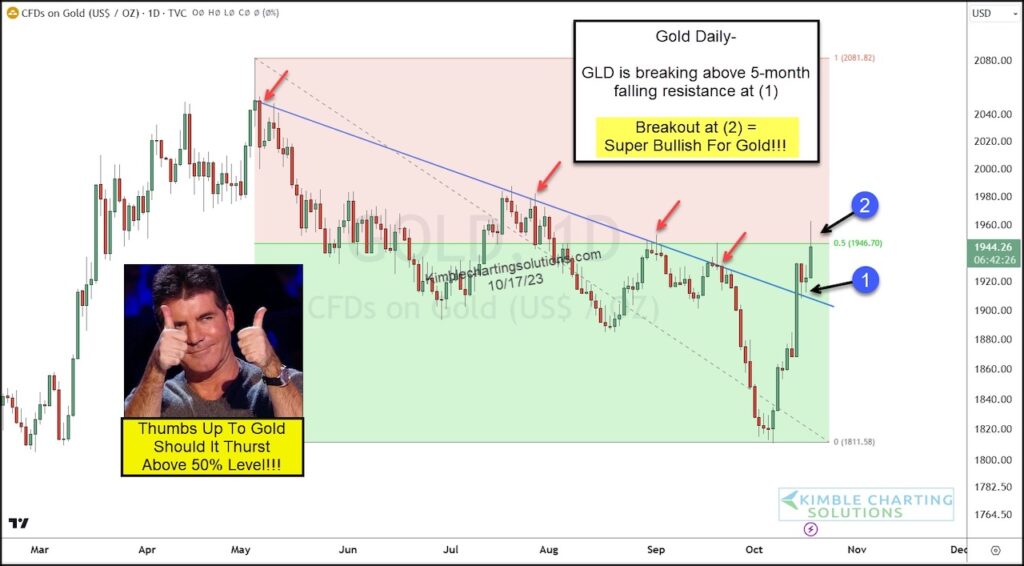
Today’s “daily” chart of the Gold ETF (GLD) shows price breaking above its 5-month down-trend line at (1). This is good news for bulls as it changes the short-term technicals from bearish to neutral.
BUT something else is happening that could be very bullish for Gold. GLD is currently trying to break out above lateral resistance at (2).
I humbly feel that a breakout at (2) would be super bullish for Gold. Stay tuned!
Gold “daily” Price Chart
Note that KimbleCharting is offering a 2 week Free trial to See It Market readers. Just send me an email to services@kimblechartingsolutions.com for details to get set up.
Twitter: @KimbleCharting
Any opinions expressed herein are solely those of the author, and do not in any way represent the views or opinions of any other person or entity.


