The price of gold is trading just off its all-time highs while the price of silver is lagging. Together, they haven’t quite provided mining equities the boost they need to out-perform the broad market.
But an 11-year cycle may be saying that gold and silver mining stocks are ready to rise again.
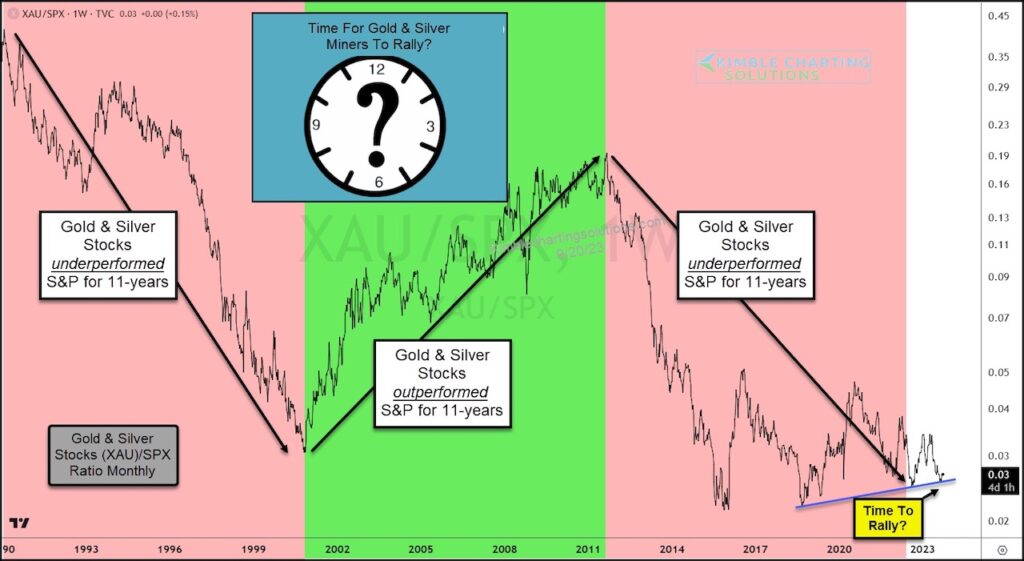
Today, we take a look at the performance of the miners versus the S&P 500 Index by charting its performance ratio since 1990. The ratio is comprised of the $XAU Precious Metals Index / $SPX S&P 500 Index.
As you can see, since 1990 the ratio appears to be working on 11 year trends/cycles.
The latest cycle of underperformance has come to an end and the ratio is trying to hold near-term support.
Time for $XAU and gold and silver mining stocks to start outperforming again? Stay tuned!
$XAU/$SPX Ratio Chart (Gold and Silver Miners / S&P 500 Index)
Note that KimbleCharting is offering a 2 week Free trial to See It Market readers. Just send me an email to services@kimblechartingsolutions.com for details to get set up.
Twitter: @KimbleCharting
Any opinions expressed herein are solely those of the author, and do not in any way represent the views or opinions of any other person or entity.

: Worrisome to Broader Market?")


