Gold prices have made a strong reversal to the upside… and it came out of a quick downturn (catching traders leaning the wrong way).
Could this give rise to a definitive breakout?
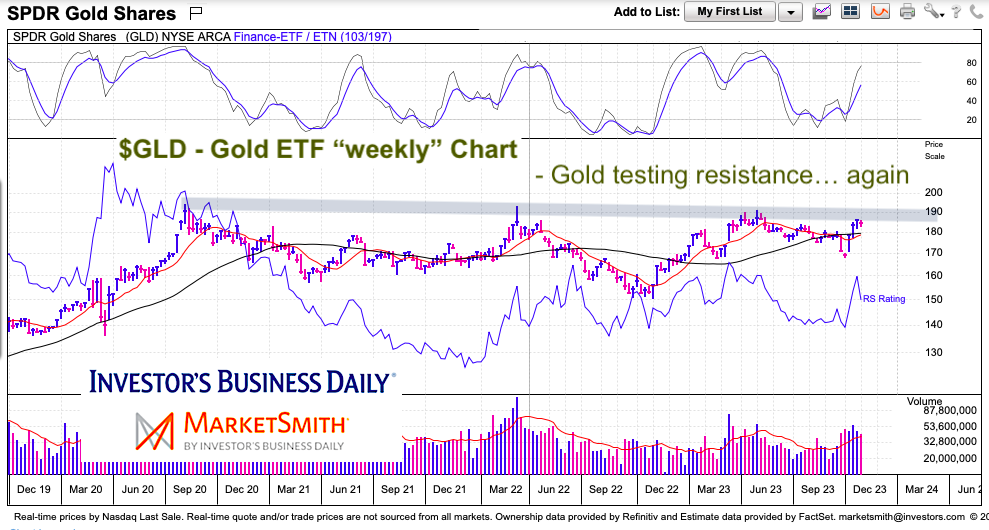
Today’s chart looks at a longer-term “weekly” view and highlights the current setup. Still work to do for precious metals bulls, but worth putting on your radar.
Note that the following MarketSmith charts are built with Investors Business Daily’s product suite.
I am an Investors Business Daily (IBD) partner and promote the use of their products. The entire platform offers a good mix of tools, education, and technical and fundamental data.
$GLD Gold ETF “weekly” Chart
Here we can see the quick undercut of the 10/40 week moving averages… before reversing higher to overtake them. Price is now nearing a test of breakout resistance. Will 3 times be the charm?
Twitter: @andrewnyquist
The author may have a position in mentioned securities at the time of publication. Any opinions expressed herein are solely those of the author, and do not in any way represent the views or opinions of any other person or entity.

: Worrisome to Broader Market?")
