Crude oil futures and the related United States Oil Fund ETF (NYSEARCA:USO) have met our expectations by rallying modestly since we last posted charts in January 2016. Now we are watching for the larger downward trend to resume.
If/When it does, it could last several months and could further reduce the price by about 40% if our elliott wave forecasts are correct.
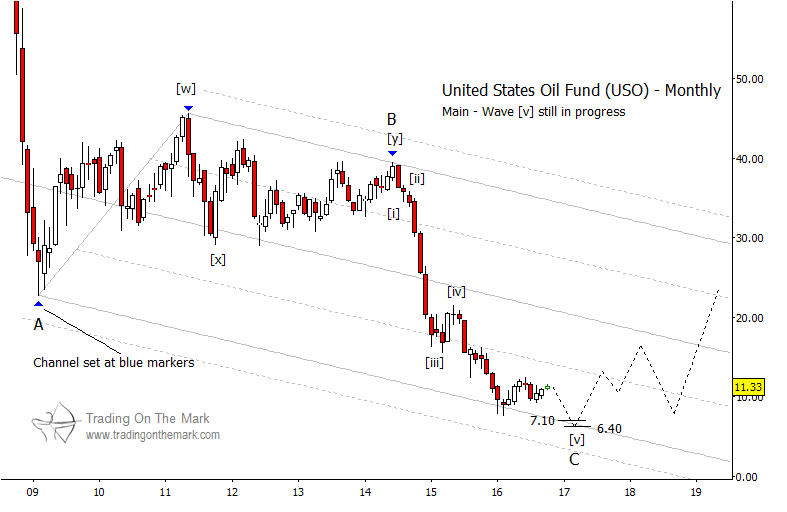
In the big picture, the Elliott wave pattern of the decline since 2008 has taken the form of an A-B-C correction for the United States Oil Fund (USO). Downward wave ‘C’ began in June 2014, and it should consist of five sub-waves. On a monthly chart, the fifth and final of those sub-waves appears to be nearly finished. USO’s price tested and bounced from channel support basically as we had sketched on an earlier chart ten months ago.
If sub-wave [v] of ‘C’ still needs to make a marginally lower low, as we expect, then traders should watch the area near Gann square-of-nine supports at 7.10 and 6.40. That area might represent a target for a downward move lasting a few months, and it might also represent an area that longer-term traders could consider a value buy.
United States Oil Fund Elliott Wave Chart – USO (Monthly)
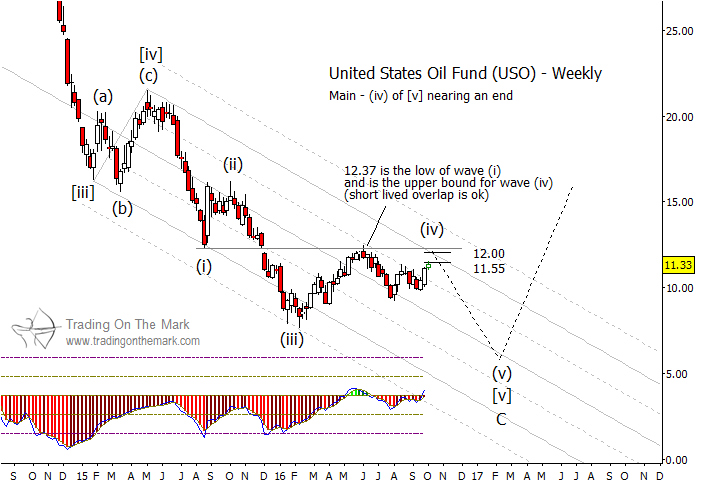
It’s easier to see on a weekly chart why the structure of sub-wave [v] of ‘C’ would look better with another low. The rally and sideways drift that has occupied most of 2016 appears to be a small fourth wave in what should be a five-wave sequence. The way the decline has obeyed a channel during the past two years reinforces this interpretation.
United States Oil Fund Elliott Wave Chart – USO (Weekly)
Also Read: Russell 2000 Topping Targets In Sight
If price indeed needs to make another low, it might embark from near the present area that has resistance at 11.55 and also at 12.00. The prospect of a downward turn appears favorable, since the adaptive CCI indicator at the bottom of the weekly chart is testing near its zero line – an event that often coincides with reversals. October also lines up as a projected high in the 60-week cycle that we monitor on futures charts (not shown here).
On the other hand, if price spends much time above 12.37, where small wave (i) ended, then we would need to reconsider our near-term forecast.
Let us help you catch the trades in these increasingly volatile markets! For a limited time, readers can receive a 20% discount on all new subscriptions by using the coupon code 4FB2A at our website.
Thanks for reading.
Twitter: @TradingOnMark
No position in any of the mentioned securities at the time of publication. Any opinions expressed herein are solely those of the author, and do not in any way represent the views or opinions of any other person or entity.


: Showing Some Signs of Emerging Strength")
