Until recently, we had been expecting crude oil prices (futures) and the related United States Oil Fund ETF (symbol USO) to plant a reversal from last summer’s price lows. We described that scenario in our last post about this market in mid-November.
Clearly we were wrong about which support level would produce that bounce as crude oil prices have been relentlessly headed lower, making new lows along the way.
However, there is useful, tradable information contained in the way the market rejected our bullish scenario, and there also are lessons to be gained from watching crude oil prices break our forecast – lessons that go beyond learning to eat crow gracefully. This post examines both of those things.
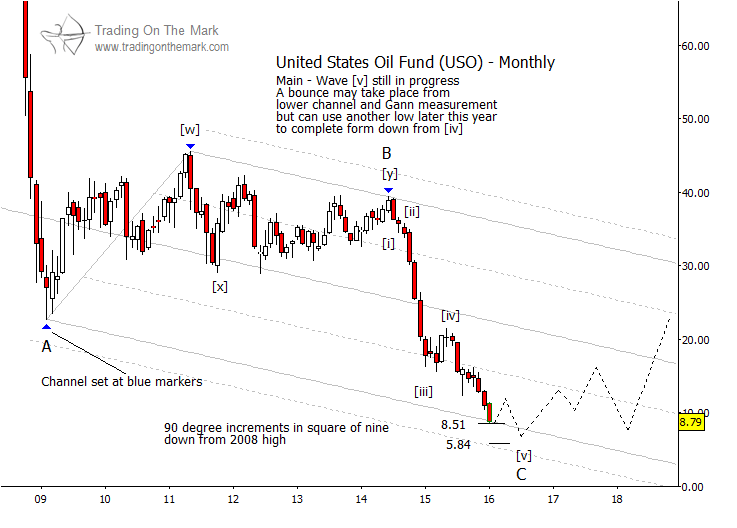
In terms of structure, it still appears correct to treat the consolidation of late 2014 and early 2015 as a fourth wave – labeled as [iv] – within a downward sequence of five waves. That implies that the selloff in crude oil prices after that point has been part of the fifth and final wave of the decline. Wave [v] of the crude oil price decline surprised us by “extending,” which essentially means that the wave grew larger than originally forecast, while continuing to play the same role as expected. In this case, the Elliott wave role of the fifth wave is to precede a reversal.
Something that we have watched throughout the market’s decline from its 2014 high has been the way price has recognized Gann square-of-nine levels as supports. It has done this both for the futures contract tied to crude oil prices and for the popular ETF (USO).
The monthly chart included below shows the next Gann levels in that sequence, and we expect that both of them should act as supports if tested – even if price moves beneath them later. Since USO tested the 8.51 area at the end of last week, this is a good area to watch for a small bounce that could last a few weeks. For traders operating on relatively fast time frames, that could represent a tradable opportunity. But discipline (and caution) is warranted, as crude oil prices have made a routine of making new lows lately.
On the other hand, even if crude oil prices bounce from nearby support, the structure of the decline from the wave [iv] consolidation does not appear complete. It probably needs one more small sub-wave, which we speculatively suggest might begin near the 5.84 support level (another Gann target). That area probably would correspond with crude oil futures prices in the vicinity of $24.60.
Readers who think of themselves as investors or longer-term traders might consider the current price area for crude oil futures (and the USO) as a good value, while also realizing that it can still go lower. Based on our charts for the crude oil market as well as our Elliott wave and cycles analysis of the U.S. Dollar, the time horizon for expecting growth in the USO fund probably extends into 2017 before the market experiences its next major downward correction.
In the longer run, perhaps during 2018 and later, price should move well above the range we expect it to traverse during 2016 and 2017. An approximate path is drawn on the chart below.
The caveat in pointing out this opportunity is that investors cannot be certain of the precise timing of a low for crude oil (that may occur in 2016). Depending on their skill at finding a good entry point, they may have to tolerate crude oil prices going against them for awhile.
One of the lessons that markets often throw at us is that movement in price depends on more than structural analysis of chart patterns. As we suggested above, an Elliott fifth wave represents a terminal move – a combination of traders’ desire to get in on an existing move (or their desire to get out of a losing position) versus their fear or hope that the move might be nearly complete. The role of a fifth wave remains the same, but the competition between momentum and exhaustion does not always produce the same outcome. When momentum overcomes exhaustion, the pattern often expands in a fractal way to the next larger size on the charts.
For a trader, the lesson of a losing trade based on an incorrect forecast is always the same, and that lesson is simply that not all trades are winners. A successful trader develops risk management practices to minimize losses, while always knowing that some loss is inevitable.
In the case of the popular Oil ETF (USO), and crude oil futures, the correct trade long on any time frame would have occurred after the charts offer one or more confirming signals (of which there are many types). And it would have involved placing trade stops at the area where the charts showed the forecast to be wrong. For some traders, the market might never have given appropriate signals to go long during recent months, and their trading discipline would have kept them out of the market.
On the other hand, an investor’s mindset allows one to ride out a negative market move that would throw traders out of their trades. As long as the investor is not using products with too much leverage, and as long as the investor can remain patient during an adverse market, the investment should produce rewards in time.
You can get timely market observations about commodities, stock market indices and more by following us on Twitter!
Thanks for reading.
Twitter: @TradingOnMark
No position in any of the mentioned securities at the time of publication. Any opinions expressed herein are solely those of the author, and do not in any way represent the views or opinions of any other person or entity.


: Showing Some Signs of Emerging Strength")
