The Crude Oil market has weakened since September, and some readers have asked whether we think a Crude Oil bottom is near. We want to address this as well as the popular Crude Oil ETF, the United States Oil Fund (USO). We believe both are still poised to rally.
Furthermore, we believe a Crude Oil bottom should form soon and a substantial bounce should begin.
The two biggest factors that go into this forecast are:
(1) the structure of the recent decline in crude oil prices and
(2) the current state of the U.S. Dollar Index.
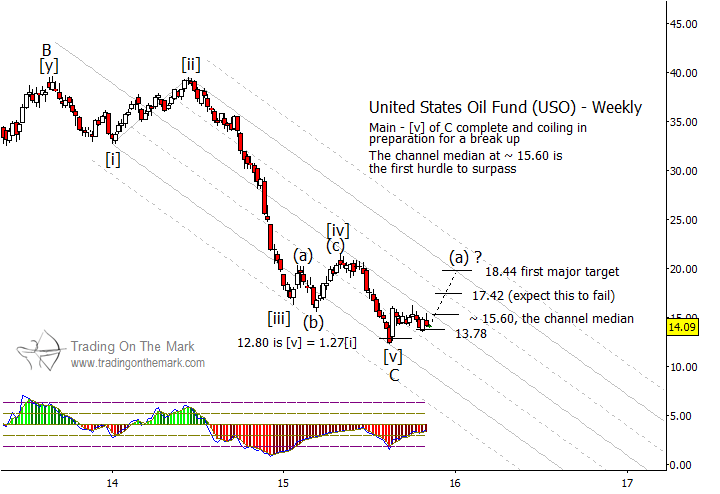
The United States Oil Fund (USO) ETF declined from 2013 into 2015 in what appears to be a complete five-wave pattern, and the decline stopped near an important support area. As the next large move, we would expect a crude oil bottom and the first leg of a multi-leg corrective pattern that should keep price approximately within the range between the high and low extremes that price has already reached during 2015.
On a faster chart with daily candles (not shown), USO’s decline in October and November appears corrective rather than the start of another impulsive (five-wave) downward move. Thus we believe USO should put in a higher low and then bounce. It is possible that USO could reach down to lower support areas, including a Gann-related support near 13.26 and a 1×1 projection at 12.88. (All price levels are approximate.)
We wrote more about the big-picture pattern and forecast for USO on October 31. We will adjust our price targets after it appears that a higher low is in place. A likely confirmation that the ETF has made a higher low would be for price to break above the middle line of the channel drawn on the chart below.
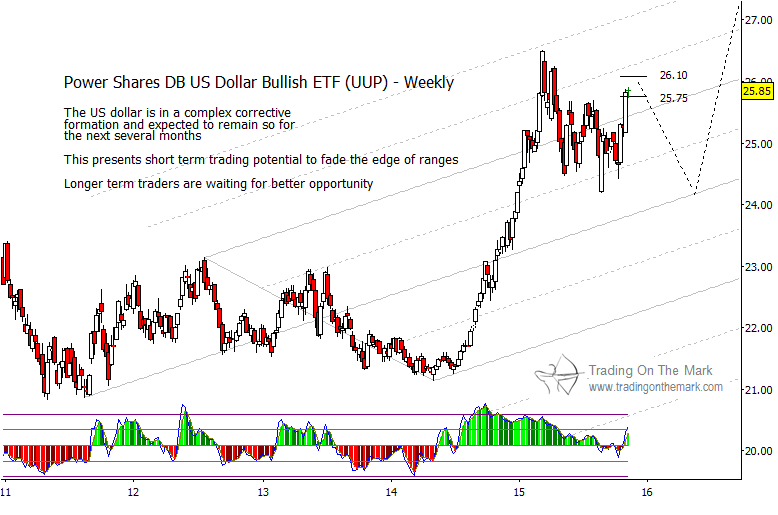
In addition to the structure of the crude oil pattern, oil prices are influenced heavily by the strength of the Dollar. The U.S. Dollar Index has been working its way through a corrective pattern in 2015, and that pattern probably has another downward leg in store. A decline in the Dollar will likely assist the formation of a crude oil bottom and subsequent rally in oil prices.
The chart below shows how the Power Shares DB U.S. Dollar ETF (UUP) is testing one level of resistance near 25.75 and is not far from another at 26.10. If the pattern works as expected, the price of the ETF should decline into 2016, even though our longer-term forecast for the Dollar is quite bullish. We also wrote about what the Dollar is doing in late October.
If this type of analysis is helpful in your trading and investing, let us know that you’d like to receive an occasional newsletter. It offers big-picture analysis and perspectives delivered to your inbox every few weeks.
Twitter: @TradingOnMark
No position in any of the mentioned securities at the time of publication. Any opinions expressed herein are solely those of the author, and do not in any way represent the views or opinions of any other person or entity.


