Tag: stock chart analysis
Is Caterpillar’s Stock (CAT) Ready to Roll to New Highs?
Caterpillar, CAT, is one of our top technical ideas coming into the week.
CAT is in an uptrend of higher highs and higher lows, and...
Stock Market Rotation Emerges Amid Key Price Reversals
Friday’s price action capped off a string of days that told a story of broadening market strength and expectations of improving economic conditions.
On a...
Nasdaq Composite Nearing Trading Top as Momentum subsides
The NASDAQ Composite looks stretched here and a momentum divergence has definitely begun to resurface after its historic rise.
In January the weekly RSI showing a...
Disney (DIS) Posts a Surprise Profit – Cycles Point to an...
Walt Disney (DIS) reported earnings after the bell on Tuesday.
Disney reported adjusted EPS of $0.08, which beat consensus estimates of -$0.64. Revenue came...
Regional Bank Stocks a Ball and Chain for Bull Market
With the Russell 2000 Index breaking out over the 50 and 200-week moving averages, investors should see nothing but blue skies, right?
Maybe.
There are lots...
Stock Market Today: Growth Stocks Come Storming Back
The stock market continues to push higher after blowout earnings from FAANG stocks.
Technology and growth stocks are carrying the major stock indices higher yet...
Is It Time to Buy Netflix Stock (NFLX) and Sell Disney...
Our trading models produce several long and short ideas each week.
Today, I share an interesting trade regarding two big names: Netflix (NFLX) and Disney...
Adobe Systems (ADBE) Emerges As Top Technical Trading Idea
Adobe Systems NASDAQ: ADBE "daily" Stock Chart
One of our top technical trading ideas right now is Adobe Systems (ADBE) which closed Friday at $444.32.
ADBE...
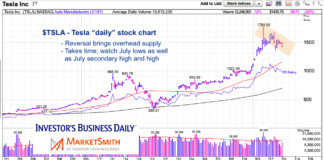
Tesla Stock Update: Reversal Highlights Time / Price Relationship
Tesla's stock (TSLA) continues to capture the imagination of investors.
TSLA has a long history of being a heavily shorted (and doubted) stock, mostly due...
S&P 500 Trading Update: Important Short-Term Resistance Into Month End
S&P 500 Index Trading Outlook (3-5 Days): The key index is bullish but nearing resistance into the weekend at $327 on S&P 500 ETF (SPY).
Important...


