Tag: fibonacci retracements
No Need To Panic On Outside Days
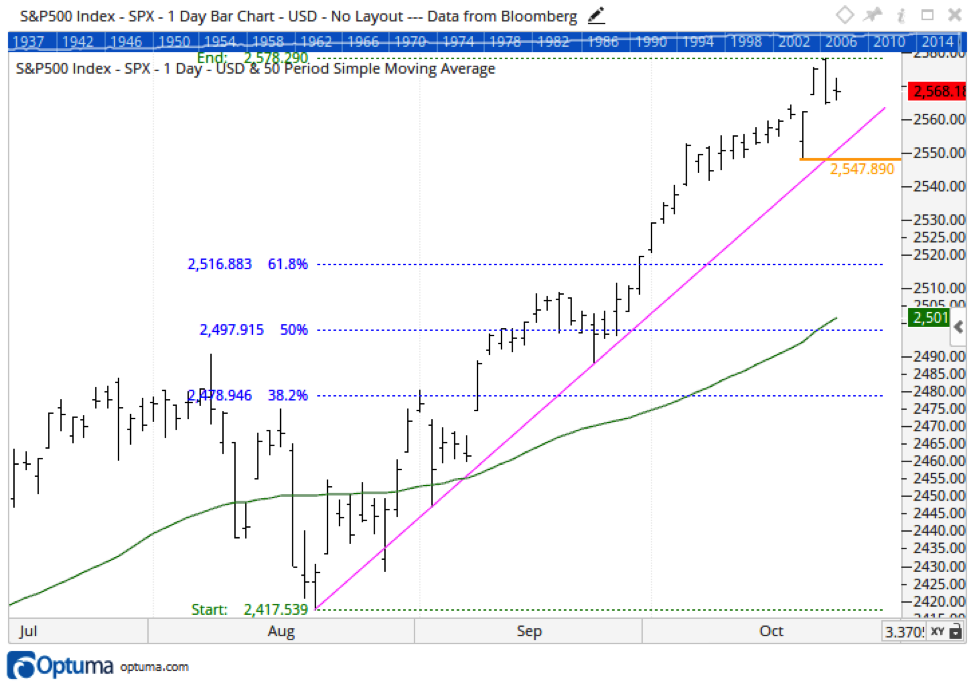
The S&P 500 Index (INDEXSP:.INX) put in an outside day on Monday. This deserves respect from traders and investors of all time frames, as well...
Apple (AAPL) Stock Chart Update: Cycles, Fibonacci, Gann
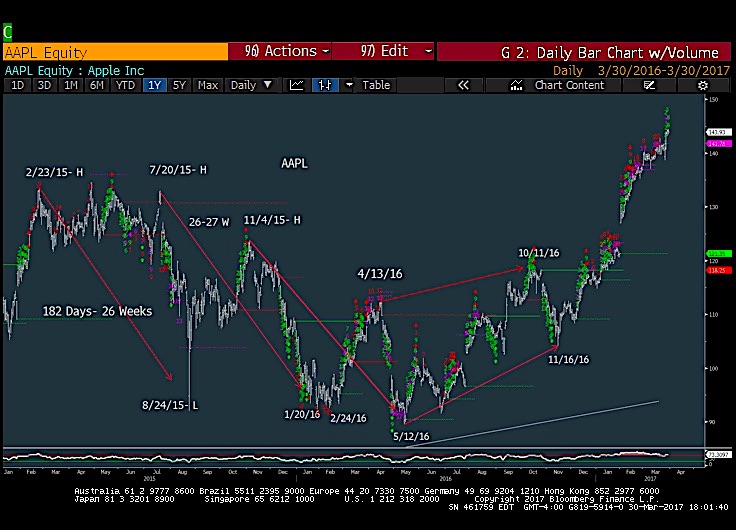
Yesterday, I shared my thoughts on where Apple's stock (NASDAQ:AAPL) was headed next. I used daily, weekly, and monthly charts to provide context and...
Treasury Bonds Chart Update (TLT): Fibonacci Price Targets
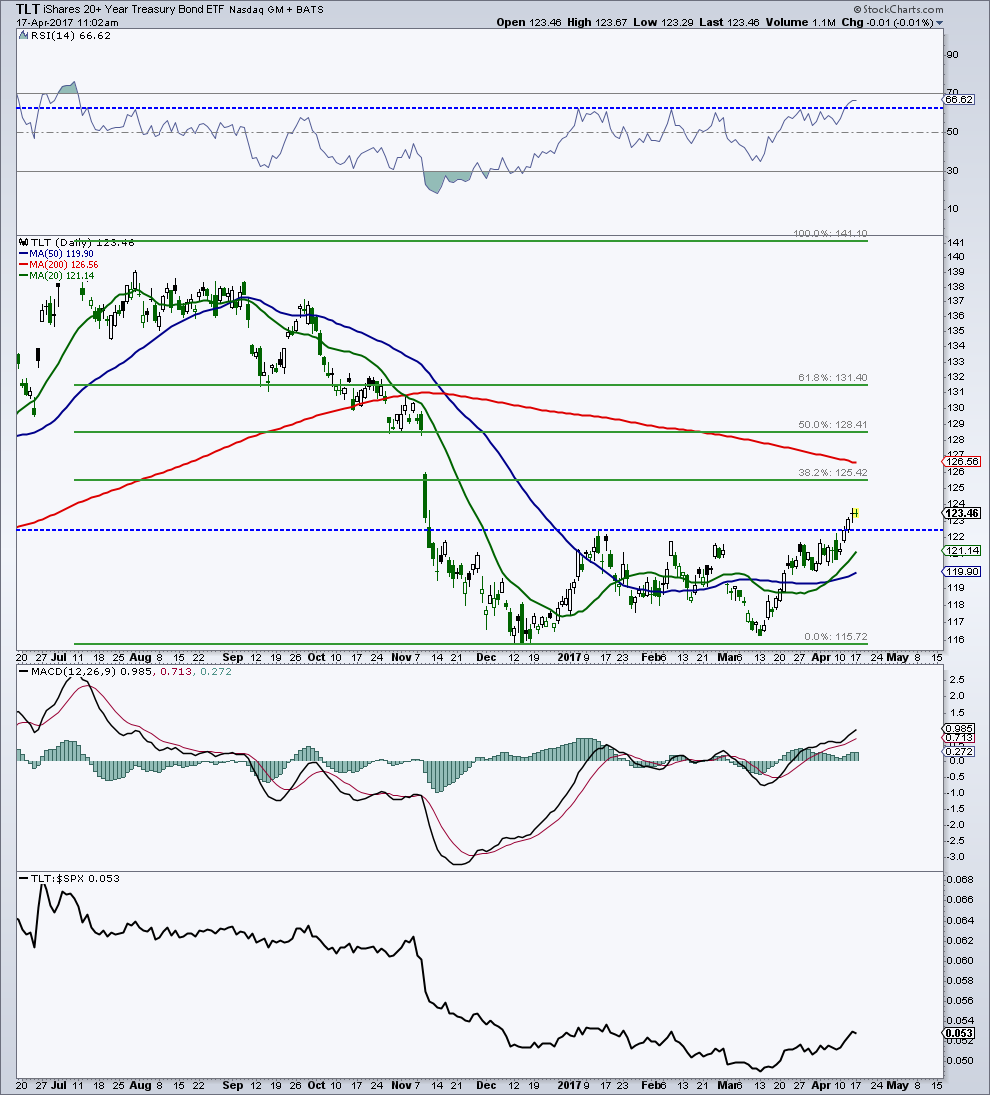
The 20+ Year Treasury Bond ETF (NASDAQ:TLT) finally broke out of a double bottom reversal formation. The move was accompanied by a bullish breakout in...
S&P 500 Target Reached, Where Do We Go From Here?
In just a month and a half the E-mini S&P 500 has rallied over 150 points. That's a pretty spectacular move - were you...
The Key To Trading Fibonacci Retracements
Trading Fibonacci retracements as a low risk/high reward entry is an approach that's been around for a long long time.
At times, it can be...
Chart Spotlight: S&P 500 Reaches Important Level For Traders
The S&P 500 Index $SPX is battling its 50 Day moving average (DMA) around 2040, seeing a major tug-o-war play out between the bulls and bears....
Crude Oil Update: Why Fibonacci Price Targets Matter
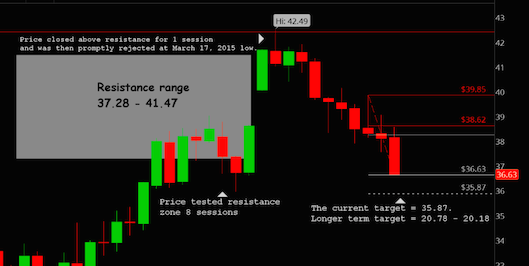
In January of 2016, I wrote an article on Crude Oil Futures where I identified a resistance zone of 37.28 to 41.47 using my Fibonacci...
Chart Of The Week: S&P 500 Testing Key Fibonacci Level!
Since putting in a double bottom formation in mid-February, the S&P 500 Index has rallied with strength over the past month. The question facing bulls...
Crude Oil Looks Lower: New Downside Price Target
The Crude oil market has garnered a lot of interest over the last year. Much of it has to do with its steep and...
Stock Market Update: $SPX Fibonacci Price Levels To Watch
Less than a month ago, I pondered the question "Is It Time To Wave Goodbye To the Bull Market In 2016?". In that post,...


