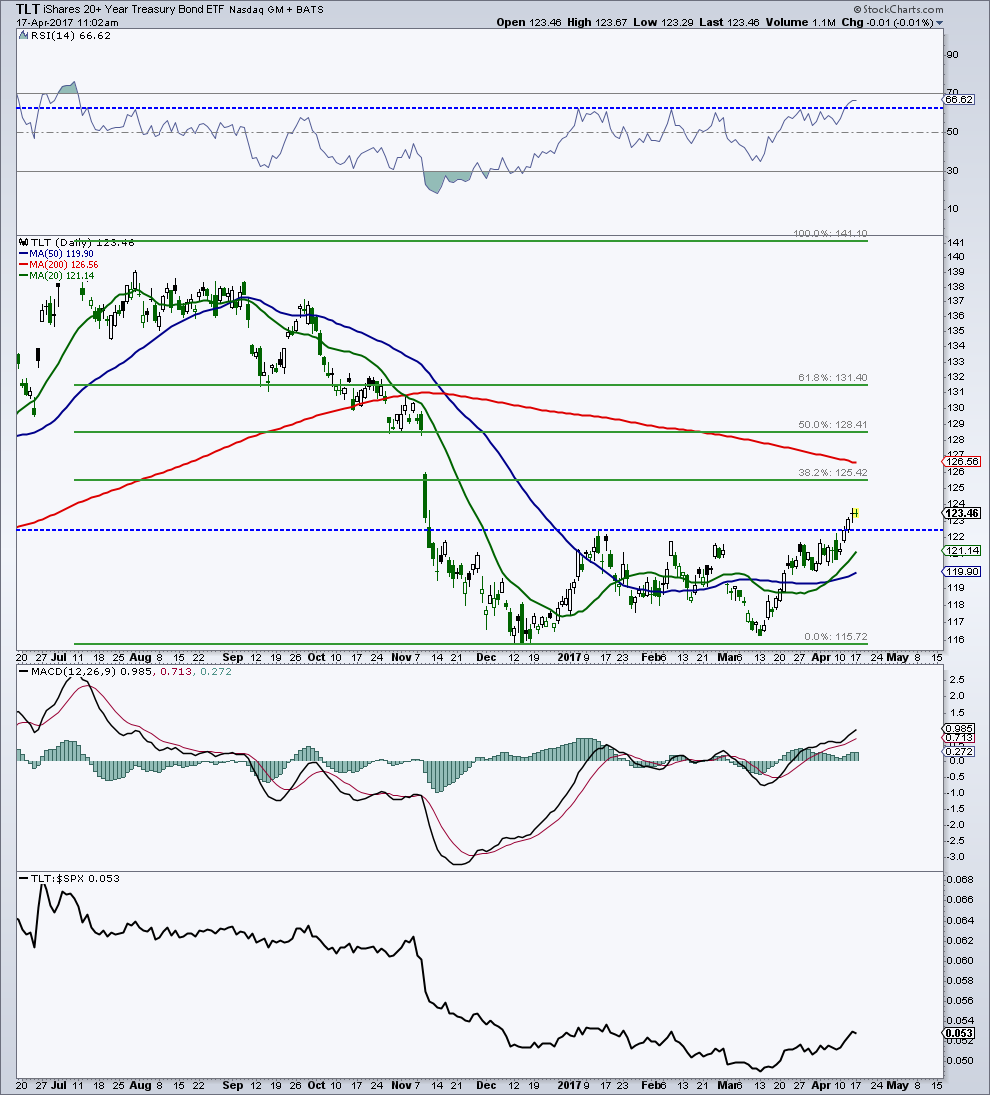
The 20+ Year Treasury Bond ETF (NASDAQ:TLT) finally broke out of a double bottom reversal formation. The move was accompanied by a bullish breakout in momentum (14-day RSI).
This development should lead to further upside for the treasury bonds ETF.
I’m looking for this move to run up to 125 to 128 area, which represent Fibonacci retracement price targets. In addition, potential resistance could come from the declining 200-day average (126.60) as well as the gap that runs from 126 to 128.31.
Based on the size of the double bottom, TLT could see a measured move up to the 129 level. Besides the breakout in the 14-day RSI, daily MACD has crossed into positive territory, another bullish momentum sign. The bottom panel shows the relative strength of TLT vs. the S&P 500. Note that bonds have been outperforming stocks since the first half of March. I have been looking for bond outperformance, both relative and absolute vs. stocks. On The Mark newsletter has been recommending TMF ETF since December 2016.
20+ Year Treasury Bond ETF (TLT) – Fibonacci Retracements
Feel free to reach out to me at arbetermark@gmail.com for inquiries about my newsletter “On The Mark”. Thanks for reading.
Twitter: @MarkArbeter
Any opinions expressed herein are solely those of the author, and do not in any way represent the views or opinions of any other person or entity.

 Rolling Over At Key Fibonacci Level?")

 Rolling Over At Key Fibonacci Level?")


