In just a month and a half the E-mini S&P 500 has rallied over 150 points. That’s a pretty spectacular move – were you a part of it?
When I look at the markets on a broader weekly perspective, I take the same approach as when I’m daytrading. Always looking to identify the trend, then allow it to pullback before entering. I use Fibonacci trading setups to guide me.
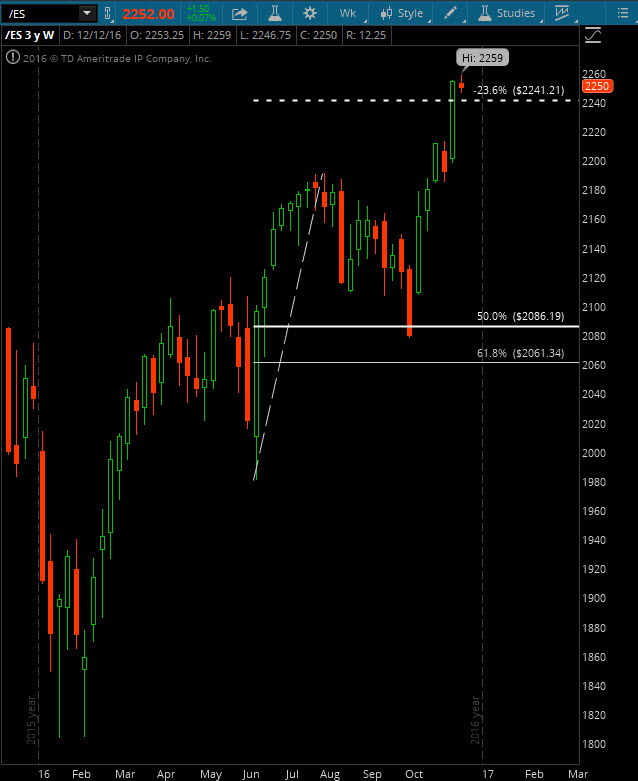
A simple Fibonacci retracement tool can be used with the 50% line enabled to give you a sense of when the market has pulled back to a “safe” low risk entry point.
The pit traders use this same approach, allowing the market to develop its trend at the open and after the first 60-mins rolls by, pulling a 50% Fibonacci retracement from that first hours highs and lows. You can see how this approach set up on a much broader time frame below (on the last pullback).
Further Reading: How To Use Heikin Ashi Candlesticks For Better Trading
The key to a great strategy is that it works across all markets and time frames. And while there are little nuances to every trading approach, Fibonacci trading setups / retracements are prevalent throughout the markets and in nature.
So where do we go from here? Heading into the new year a sideways consolidation followed by a slight pullback to previous highs can be expected before another leg higher. This would signify a healthy market.
Happy holidays and cheers to a new year! More trading education by me can be found at my site EminiMind. Thanks for reading.
Twitter: @EminiMind
Any opinions expressed herein are solely those of the author, and do not in any way represent the views or opinions of any other person or entity.


: Showing Some Signs of Emerging Strength")
