Heikin Ashi Candlestick: This Unknown Candlestick is Highly Valuable to Short-Term Traders
One of the most popular chart types among traders is the Japanese Candlestick. But there is a lesser-known candlestick that can dramatically benefit your trading. The Heikin Ashi Candlestick.
So, What’s the Difference?
A traditional candlestick chart plots the open, high, low, and close of each bar. A Heikin Ashi candlestick uses the midpoint of the prior bar as the “open” price of that candle.
Why is this important? Because of the way Heikin Ashi candlestick charts are calculated, it makes it easier to identify the trend, and trend changes. Read more here from StockCharts.com.
Identifying Trending vs. Range Bound Markets
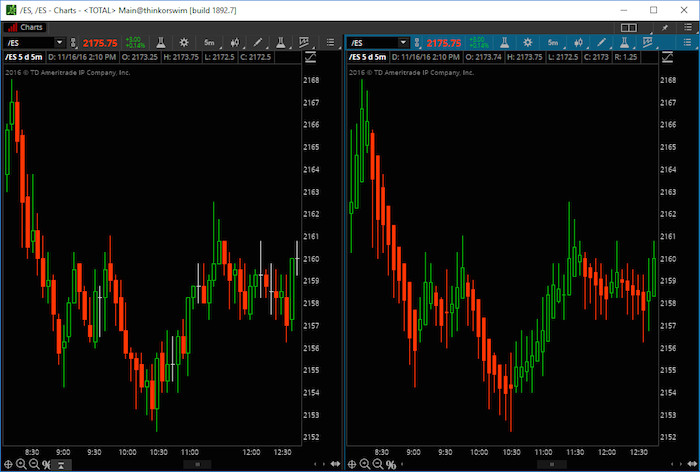
An example of a traditional candlestick chart on the left and a Heikin Ashi chart on the right. Both charts are using the same data and the same time frame.
Notice how the bars on the Heikin Ashi chart remain shaded the same color while in trend, only to change color once the trend changes.
Heikin Ashi charts are useful in non-trending markets as well. In a non-trending market instead of seeing a smooth series of bars between changes in color, we have sporadic and rapid changes back and forth. Because we know that a series of consecutive same color bars indicates a trending market, the lack therof helps us identify a range bound market.
Using Heikin Ashi Charts to Gain an Edge In Trading
One technique a trend trader can use to gain an edge in the markets is to wait for the first the color change before entering. This ensures that you are entering at the earliest point in a potential trend change.
If the larger trend is up and we are moving higher in a series of higher highs and higher lows, waiting for a pullback and the first candle to change color, signals the possible resumption of the uptrend.
You can also use a Heikin Ashi Candlestick chart to aid in your trade management, by trailing your stop above or below each candle as the trade works in your favor.
Fitting Hekin Ashi into Your Current Methodology
Putting as many odds in our favor gives us the best chance to succeed. Incorporating Heikin Ashi candlesticks into your current methodology can help you better identify the trend changes and gain an edge in the markets.
More can be found at EminiMind.com. Thanks for reading.
Twitter: @EminiMind
Any opinions expressed herein are solely those of the author, and do not in any way represent the views or opinions of any other person or entity.


: Showing Some Signs of Emerging Strength")
