Since putting in a double bottom formation in mid-February, the S&P 500 Index has rallied with strength over the past month. The question facing bulls now is: Will this rally develop into something more than a sharp bear market rally?
Well, the index slowed its ascent last week and has been consolidating for much of this week. And there’s a good reason for this.
The S&P 500 rally has taken stocks back up to its 61.8% Fibonacci retracement level (using the highs of last year and the February price lows).
Today the index is rallying yet again… right into this S&P 500 Fibonacci resistance level. And how stocks react here could change the near-term outlook (and price structure). In short, a breakout above the 61.8 Fibonacci resistance level would be a positive for the broader stock market indices (and global markets). Bulls definitely don’t want to see a reversal around this level!
S&P 500 Fibonacci Resistance Looms Large
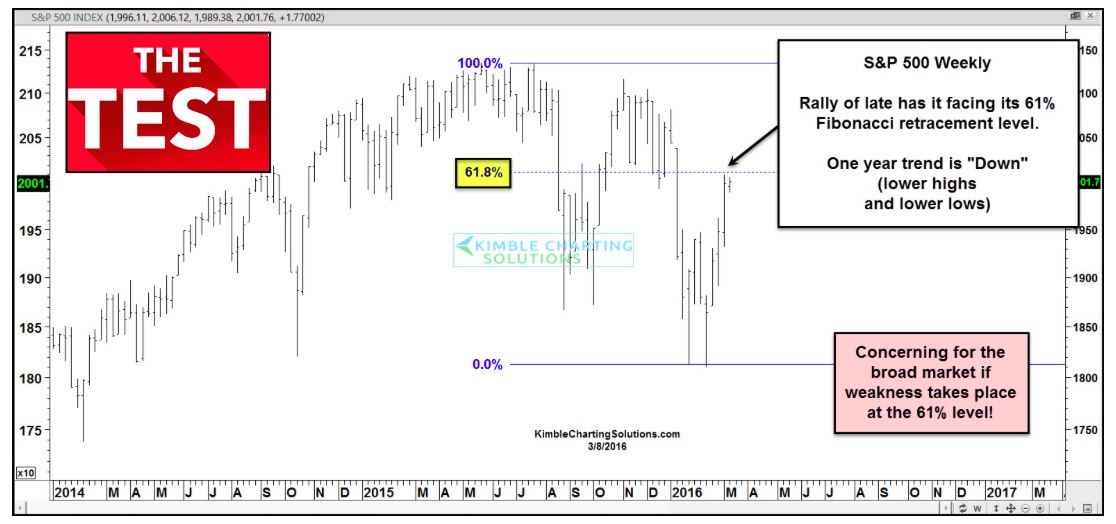
If bulls can clear this S&P 500 Fibonacci resistance level, then the next key level will be 2080 (the last lower high). This would break the broader lower highs and lower lows formation on the stock market. But one step at a time.
Thanks for reading.
Read more from Chris: “These Market Reversals Are Giving Bulls Hope Again“
Twitter: @KimbleCharting
The author has a position in mentioned securities at the time of publication. Any opinions expressed herein are solely those of the author, and do not in any way represent the views or opinions of any other person or entity.


