In the past few weeks, the financial markets have changed character. Stocks have rebounded, while defensive sectors like Utilities and Treasuries have declined. Could these market reversals be the price action that bulls have been waiting for?
Well from a trading perspective, it has been. Longer-term, the jury is out.
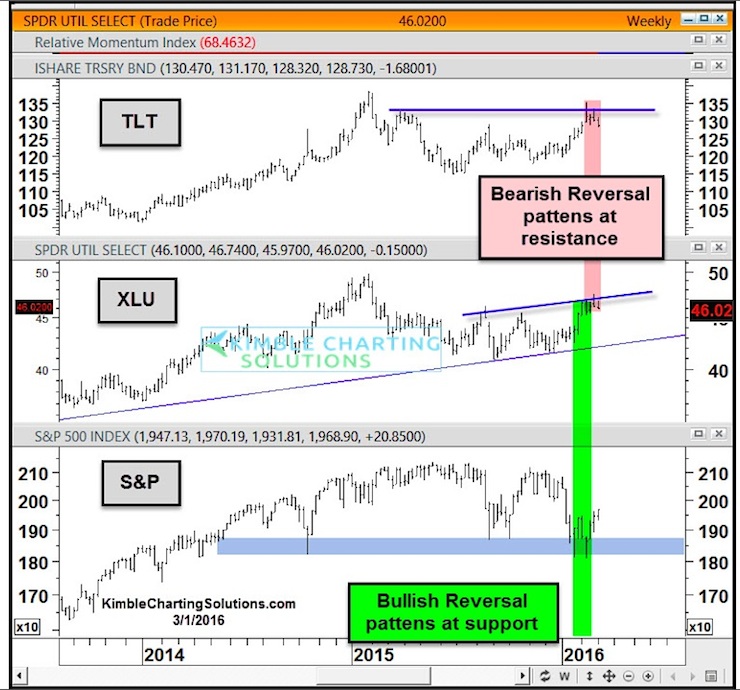
Let’s look at the chart below to add some color and highlight some things to keep an eye on.
In both January and again in February, the S&P 500 Index put in weekly bullish market reversals. These patterns emerged at 2 year horizontal price support.
And just as stocks were busy putting in a market reversal, U.S. Treasuries (TLT) and Utilities (XLU) were putting in weekly bearish market reversals at horizontal price resistance.
In both cases, the horizontal lines are “lines in the sand”. Market bulls will now look for expanding market breadth and follow through to the upside over the coming days and weeks.
Although we still need to see how the market handles the next pullback, the potential message is that multi-month market reversals may be taking shape. And that could take the stock market higher in the months ahead.
Thanks for reading.
Read more from Chris: “Gold vs The US Dollar: Can Precious Metals Regain Their Luster?“
Twitter: @KimbleCharting
The author has a position in mentioned securities at the time of publication. Any opinions expressed herein are solely those of the author, and do not in any way represent the views or opinions of any other person or entity.


