For those of you who read our Daily are by now, learning about the value of our scanning tools, quants and the Complete Trader.
What we are trying to accomplish, is not only how best to use the product, but how to focus on key patterns especially those that are in line with megatrends.
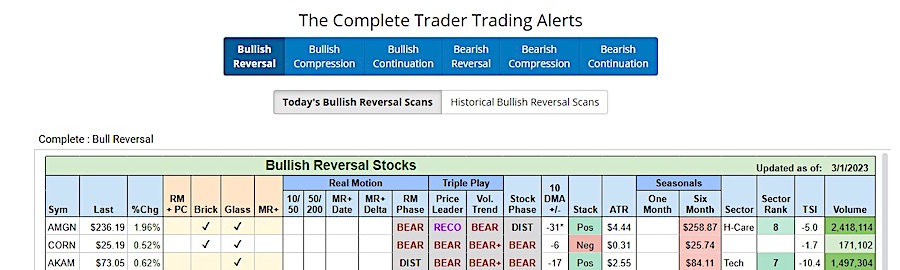
For example, on February 21st, Classic Short Setup in Tech featured Akami (AKAM). At the time, the stock closed at $76.40. The stock fell to a low of $72.14 in 6 trading days.
Now, you see it on the Bullish Reversal Scan.
However, buying it does not interest us.
The stock is in a major downtrend. So, I would take the information to either take some profit if short, or lower the stop to cover to ensure a profit regardless of what happens from here.
What does interest us though, is the Bullish Reversal in CORN.
Incidentally, Amgen Inc.’s (AMGN) a bit more interesting as it also reversed right after it touched down on the 200-week moving average.
But not the focus for now.
The CORN ETF is of interest as agricultural commodities have fallen a lot lately.
As far as we can tell, food supply and shortages remain a concern going into the spring and summer growing seasons.
The Complete Trader Scan checks off 2 boxes. Brick and Glass Bottoms.
The Brickwall pattern is a 2-day pattern where the stock puts in a new 60-day low on wide-range move and then reverses and closes the next day in the upper portion of its trading range.
The price phase is bearish.
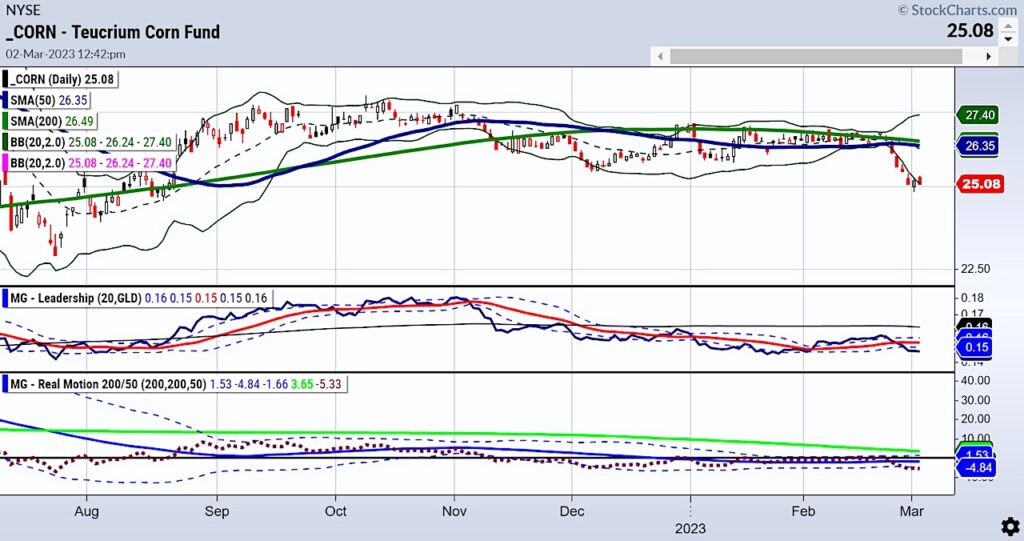
Momentum as illustrated by Real Motion, indicates a bearish trend. Although as you can see from the chart of CORN, it has the potential for a mean reversion.
The monthly chart is also interesting.
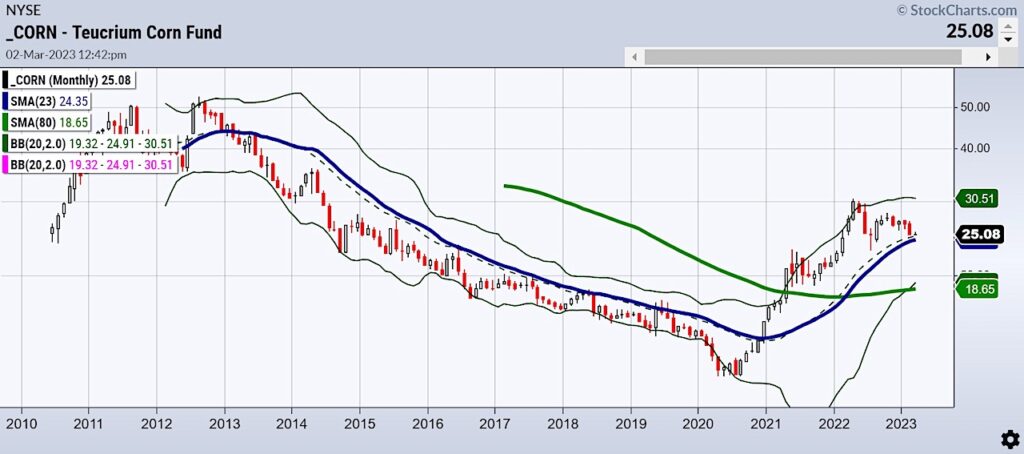
Note how the price holds the 23-month moving average or the 2-year business cycle-still intact. That is positive. And a good risk point.
Going back to the daily chart, we would want to see the price clear over Tuesday’s high or the reversal day high.
Moreover, watch for a mean reversion on Real Motion.
It is a bit of a trip back to the overhead 50 and 200-DMAs-but REMEMBER:
We never know the future-yet we can ascertain the past by seeing where to place a good stop loss to control risk.
Last note-the topic of March 1st Daily Stock Market Update — Steel Dynamics (STLD) and comment, “may be on the verge of another breakout after a month of price consolidation.”
Stock closed up nearly 3% today.
Stock Market ETFs Trading Analysis & Summary:
S&P 500 (SPY) 390 support with 405 closest resistance
Russell 2000 (IWM) MA support around 184. 190 has to clear
Dow (DIA) 326 support 335 resistance
Nasdaq (QQQ) 284 big support 300 resistance
Regional banks (KRE) Back to weak link under 60-could be a warning
Semiconductors (SMH) 228 support 240 pivotal 248 key resistance
Transportation (IYT) 240 resistance as best Mod Fam performer and 230 support
Biotechnology (IBB) 125-130 new range
Retail (XRT) Comeback a little but has to clear 66.40 or warning like KRE
Twitter: @marketminute
The author may have a position in mentioned securities at the time of publication. Any opinions expressed herein are solely those of the author and do not represent the views or opinions of any other person or entity.

: Worrisome to Broader Market?")
