Akamai (stock ticker AKAM) is a cloud computing company in the tech sector that deals with online security. Up until mid-2022, the trend was up.
Then, with the hawkish FED, the trend changed, with AKAM eventually breaking the 23-month or 2-year business cycle in May 2022. It just goes to show you how many companies prospered in a low interest rate-corporate buy back environment, until….
The recent earnings report was decent. U.S. revenue for the fourth quarter was $483 million, up 1% year-over-year. U.S. revenue for 2022 was $1.902 billion, up 4% year-over-year.
Nonetheless, tech in general will have a hard time in the new paradigm of higher interest rates, apparently for longer.
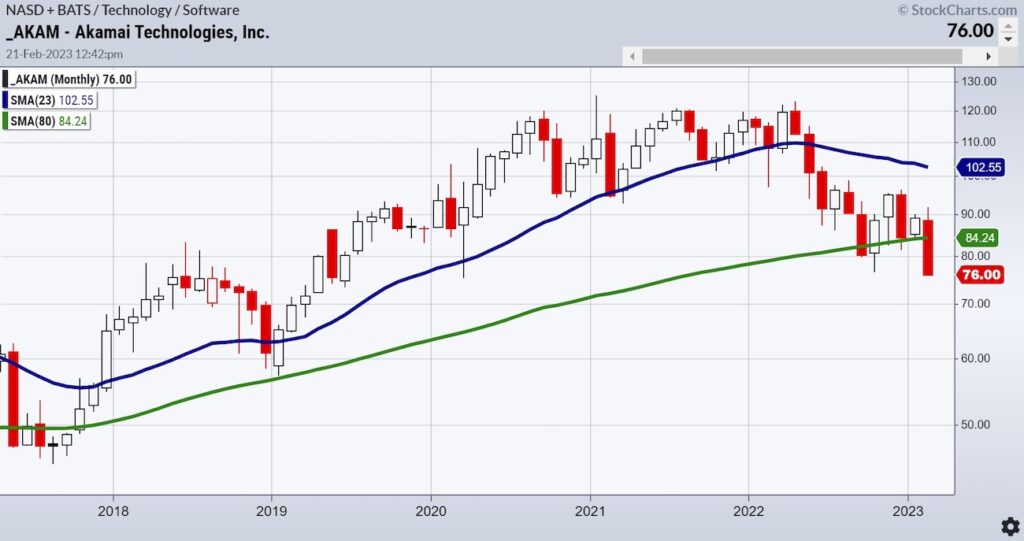
The monthly chart shows a clean breakdown under the 80-month moving average. This is a 6-7 year business cycle. Our interpretation is that this stock will act more inline with the potential oncoming recession or stagflation environment.
How did we find this stock and what does the daily chart look like?
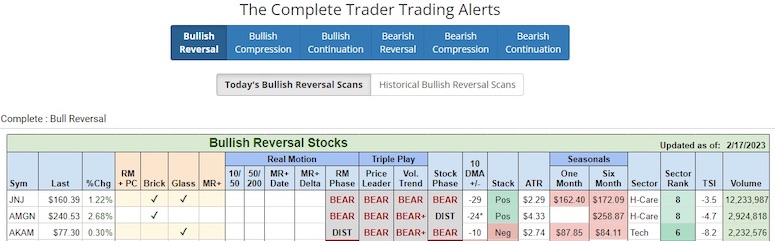
This scan is from our Complete Trader product. This scan is from last Friday.
It showed a bullish reversal pattern in the form of a glass bottom. However, the Real Motion phase is Distribution (50 over the 200-DMA but price momentum below both MAs).
The stock’s phase is bearish so the reversal intrigued us a possible low risk buy-and then the market declined to start off the shortened week.
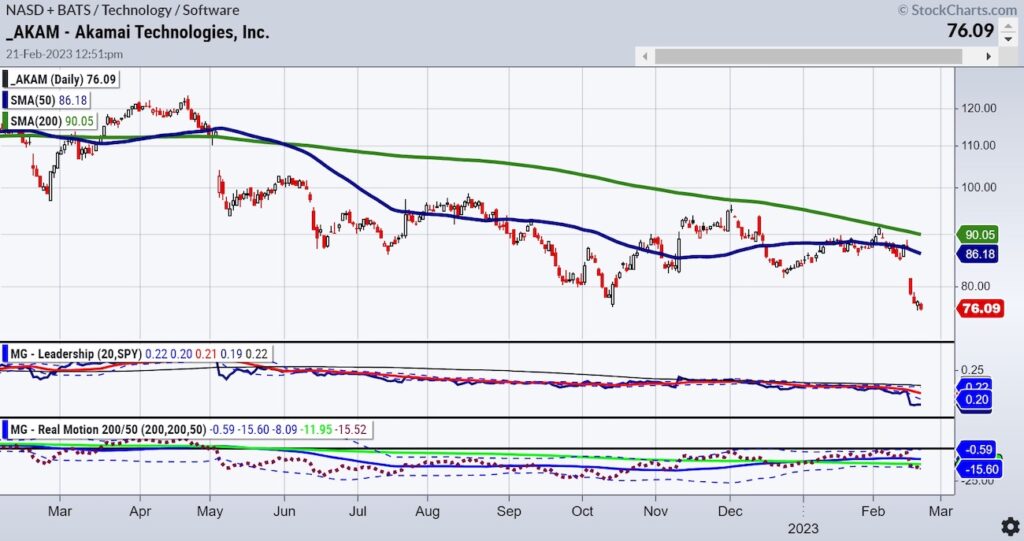
So, we checked the daily chart.
Real Motion (our momentum indicator) broke the Bollinger Band which confirms the weakness of the entire tech sector.
On Leadership, AKAM is well underperforming the benchmark.
Perhaps the most interesting part of the chart though, is that it had an inside day Monday. That tells us one of two scenarios to follow:
How do you use the monthly chart?
Feel bolder that the overall trend is down if the stock fails Friday’s lows. Know that if you buy, it could be nothing more than a short-covering rally rather than a true bottom.
Finally, watch for a mean reversion as the Bollinger Band on Real Motion can go either way.
Tech in general had an awful start to the week with a FOMC announcement on the way.
Akami could just wind up not only as a decent trade, but also a barometer of the next direction of growth and tech stocks.
All this from our incredible Complete Trader scan!
Stock Market ETFs Trading Analysis & Summary
S&P 500 (SPY) Closer to the 390 support with 405 closest resistanct
Russell 2000 (IWM) Heading to major weekly MA support around 184. 190 has to clear again
Dow (DIA) 326 support 335 resistance
Nasdaq (QQQ) Those 2 inside weeks resolved to the downside. 284 big support 300 resistance
Regional banks (KRE) 65.00 resistance 61 support
Semiconductors (SMH) 228 bigger support and 240 resistance
Transportation (IYT) Landed on the 50-DMA so has to hold or more pain
Biotechnology (IBB) Under 130 now (pivotal)-even biotech feels the pinchRetail (XRT) 66-68 huge area to hold if the market still has legs
Twitter: @marketminute
The author may have a position in mentioned securities at the time of publication. Any opinions expressed herein are solely those of the author and do not represent the views or opinions of any other person or entity.


 Sending a Warning to Tech Stocks?")


