S&P 500 Trading Outlook (3-5 Days): Neutral
No change here. There is some minor evidence of stalling out, though I would need to see more weakness to lean short.
Market breadth is flat and Demark exhaustion has been completed. So for those wishing to pick a spot to sell into this uptrend, we seem to be close yet again to a good risk/reward area.
A Move UNDER 2764 on a close is a sell signal, and should drive prices down initially to 2729-2731.
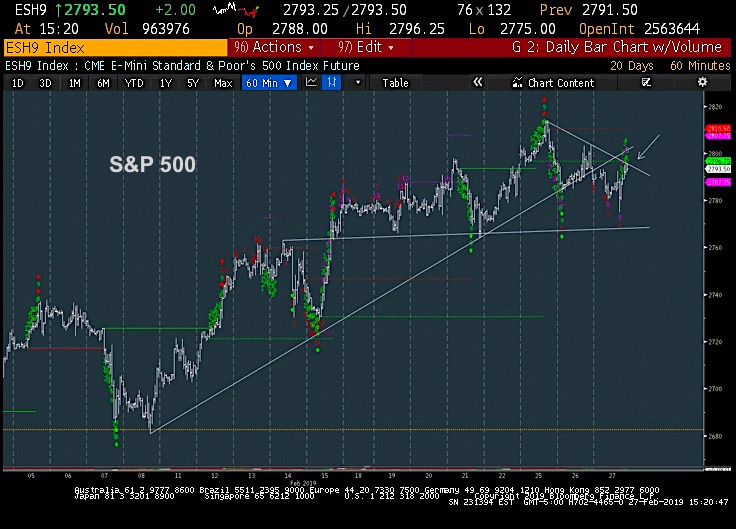
S&P 500 Trading Chart
The broad stock market index is seeing momentum slow and breadth weaken. However, as I mentioned, it’s a MUST to get down under last week’s lows of 2764 to signal any real damage.
For now, this chart (below) shows insufficient weakness to expect any real pullback just yet. A move above 2798 would allow for a push back to new highs. So bears still need to see some evidence of price turning down.
If you have an interest in seeing timely intra-day market updates on my private twitter feed, please follow @NewtonAdvisors. Also, feel free to send me an email at info@newtonadvisor.com regarding how my Technical work can add alpha to your portfolio management process.
Twitter: @MarkNewtonCMT
Author has positions in mentioned securities at the time of publication. Any opinions expressed herein are solely those of the author, and do not in any way represent the views or opinions of any other person or entity.


")


