U.S. Markets
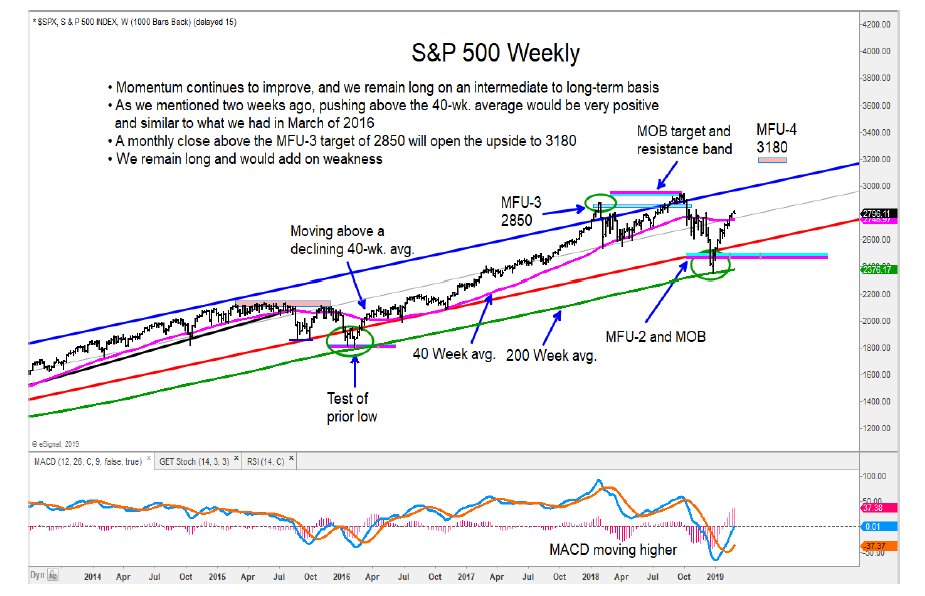
Not much has changed in a week. Upside momentum remains firm and we have a number of stock market indices above their 40-week average.
Although most of the U.S. stock market indices reviewed are overbought short term, it’s a “good overbought” where any weakness is short lived and met with more demand.
We remain bullish on an intermediate to long-term view and would use any near-term weakness as an opportunity to add to favorite names. Below is a look at the S&P 500 “weekly” chart.
European Markets
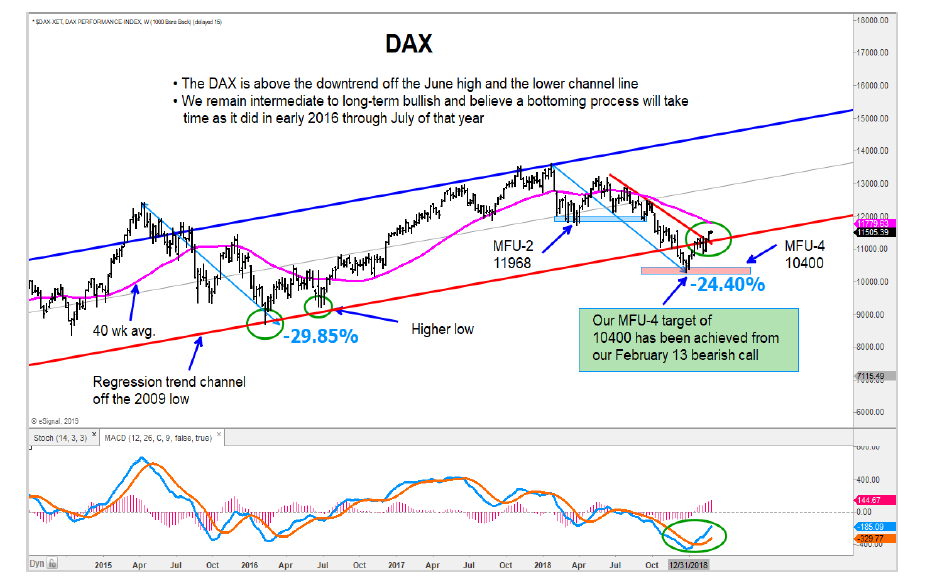
The DAX has cleared above a resistance area and we would be adding to longs. The CAC is up 15% from where we got our buy signal and it is now making its way above the 200-day average.
We remain long both of these markets. Both Spain’s IBEX and Italy’s FTSE MIB are well contained in downtrends are we remain cautious. Below is a look at the German DAX “weekly” chart.
Asian Markets
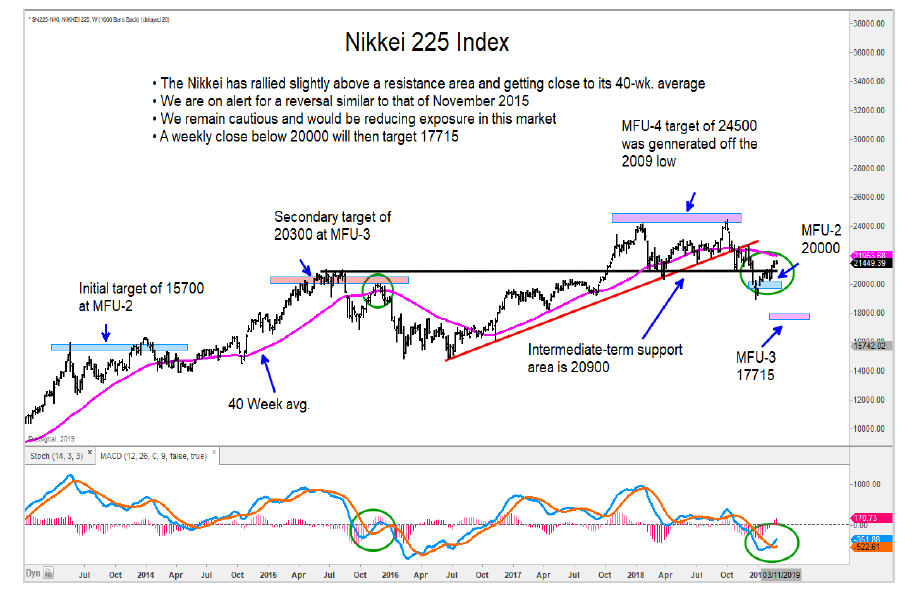
The Nikkei is close to its downward sloping 40-week average and we are concerned that it will fail as it did in November 2016. We remain cautious for now. The Hang Seng has a decisive move above its one-year downtrend and 40-week average.
We are on alert for the potential of a low being carved out, similar to what occurred in 2016. Below is a look at the Nikkei 225 “weekly” chart.
Emerging Markets
The Kospi 100 and Singapore’s Straits Times Index are up into resistance area and we remain cautious.
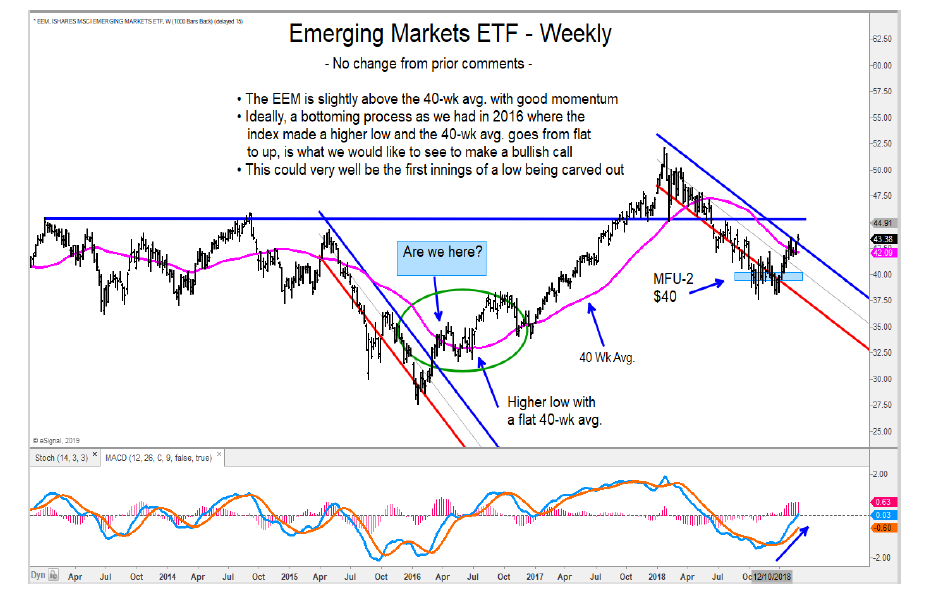
The Emerging Markets ETF (EEM) is gaining upside momentum. There is a good chance that a low is forming similar to what we had in 2016. Below is a look at the EEM “weekly” chart.
Author has positions in mentioned securities at the time of publication. Any opinions expressed herein are solely those of the author, and do not in any way represent the views or opinions of any other person or entity.


 Flirting With Critical Support… Again")

