It’s time for another round of macro technical charts as investors attempt to weigh the risk to reward ratio across several markets (including stock market indices, sectors, individual commodities, currencies, bonds, and other benchmarks and market indicators).
This chart review will look at 5 charts with important technical price developments. Even if you’re not technical analysis minded, I believe that it’s a useful way to stay on top of global market trends across several major financial markets. You can also use this chart analysis as a prompt for further analysis and investigation…
In this edition we look at Crude Oil, Treasury Yields, the US Dollar, Biotech, and the Russell 2000.
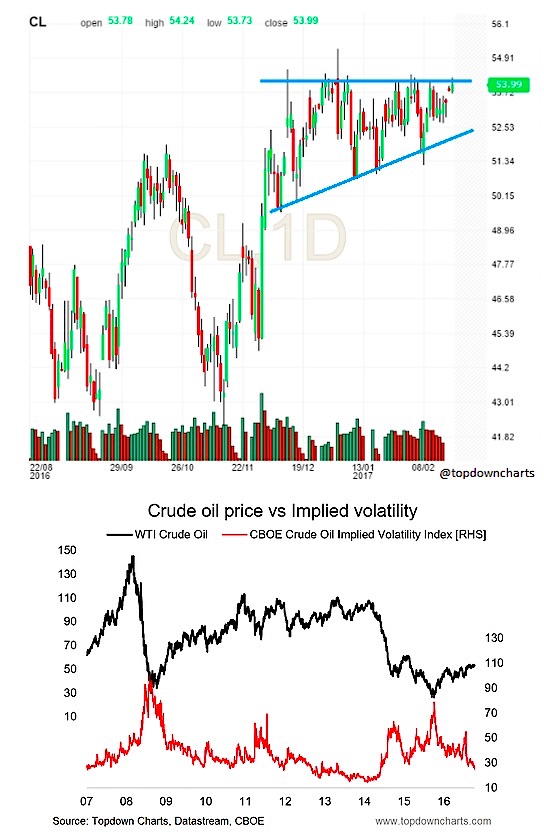
1. Crude Oil – Triangle Pattern
An ascending triangle is developing on crude oil. The initial price target would be around $59 a barrel.
I previously talked about the crunch in volatility for Crude Oil in the commodities special edition of the Weekly Macro Themes, but the implied volatility index for oil has also fallen considerably, and it could be a harbinger of a potential surge in volatility to come… in other words an explosive price move (one way or the other). Also watch Oil ETF (NYSEARCA:USO).
Overall technical view: Waiting for the break, bullish bias, could be an explosive move when it gets underway.
NEXT CHART (US Treasury Yields)…


