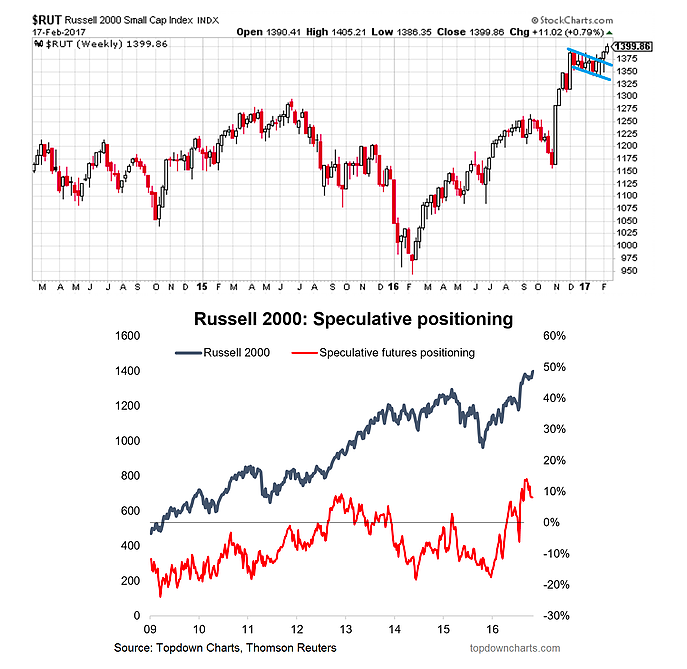
5. Russell 2000 – Another Breakout
The second breakout is in the Russell 2000 index (INDEXRUSSELL:RUT), where the bull flag pattern on the weekly chart has been completed with an upside breakout. The measure rule (flag, which slopes against the previous trend, appears half way up the flagpole) would point to a price target for US small caps at about 1580 (or about a 13% move from here).
Speculative futures positioning (as talked about in the 16 Dec issue of the Weekly Macro Themes) remains stretched to the upside, as it often does during strong market moves, but has pulled back slightly.
Overall technical view: Bullish
Thanks for reading.
Twitter: @Callum_Thomas
Any opinions expressed herein are solely those of the author, and do not in any way represent the views or opinions of any other person or entity.


