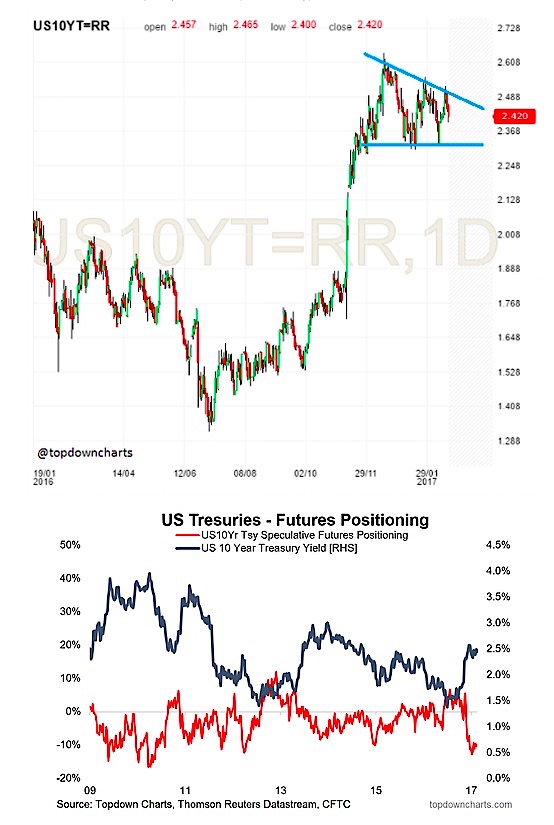
2. Treasuries – Another Triangle Pattern
Notable descending triangle spotted in US treasuries – the 10 Year Treasury Yield (INDEXCBOE:TNX). The measure rule would set initial price target for a downside break of around a yield of 2%, which would still position it around the top end of the previous range. The second chart below shows speculative futures positioning as stretched to the short side – this would tend to bias the expectation toward a drop in yields from a contrarian standpoint.
Overall technical view: Would expect yields to fall (bond to rally), but need to see a breakout.
NEXT CHART (US Dollar Index)…


