The S&P 500 Index (INDEXSP:.INX) closed the month of November today at 2,647.56, a fresh new all-time high monthly close.
The Index gained 2.81% in November, and is now higher by 18.26% in price-only returns thus far in 2017.
When including dividends the S&P 500 has now increased 13 consecutive calendar months, which is absolutely stunning. I repeatedly tell my clients that the price of the S&P 500 will trade beyond the limits of human imagination, and the last 13 months are a perfect example.
We’re now one month away from a perfect calendar year, or a calendar year where the price of the S&P 500, including dividends, increases January through December. To the best of my knowledge, that’s never happened before and could very well be another S&P 500 record streak.
So, What’s the forecast for December? Well, there’s two conflicting historical setups that I find interesting, one “bearish” and one “bullish”.
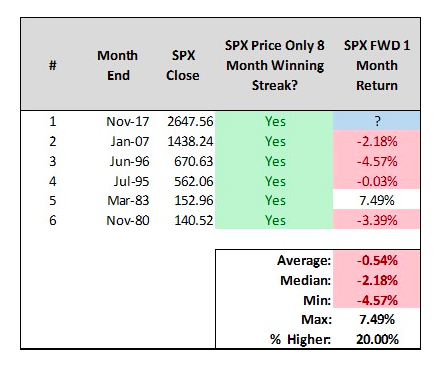
First, 8 month price-only winning streaks for the S&P 500 since 1970 haven’t historically made it to 9. November marks just the sixth sample of an 8 month price-only winning streak for the S&P 500, and only 1 of the prior 5 instances saw the monthly winning streak make it to 9 (April 1983).
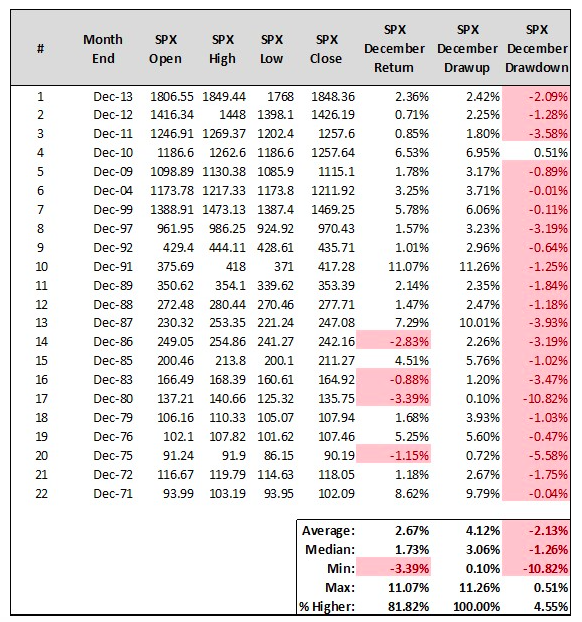
Alternatively, recall that 2017 recorded as a Wayne Whaley “Bullish” TOY calendar year (if that’s foreign to you, read this piece I did for www.seeitmarket.com here and sign up for Wayne’s work here). The month of December in Whaley “Bullish” TOY years has seen the S&P 500 close higher 13 samples in a row, and 18 of 22 overall, since 1970.
ALSO READ: Russell 2000 BB Squeeze: A Massive Move Is Coming
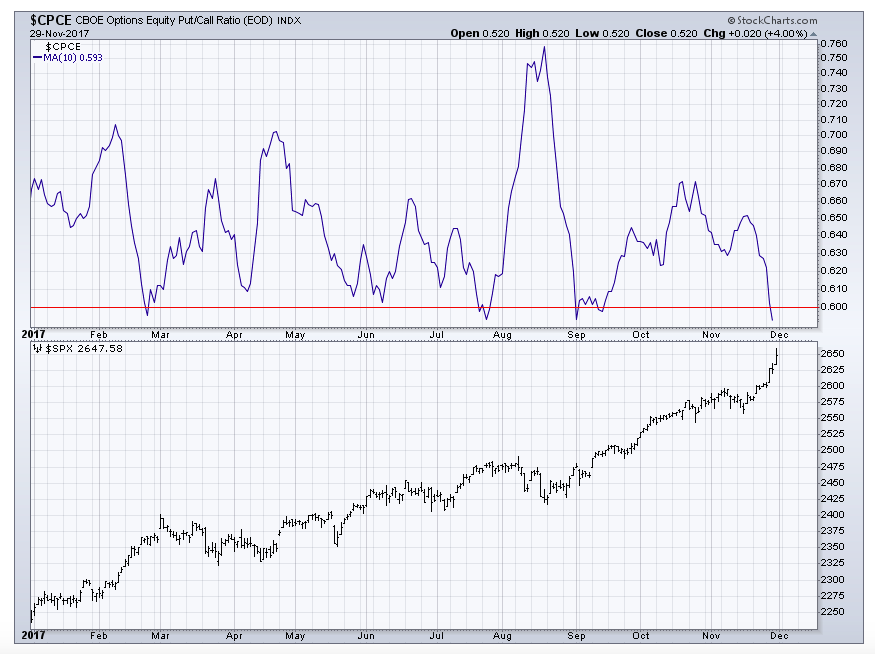
I certainly believe the odds favor a higher close for the month of December, but there is growing evidence that we should expect some turbulence along the way. First, the 10-day average of the CBOE’s Equity Put/Call Ratio (CPCE) will close below 0.60 today. Closes below 0.60 preceded both March and August’s pullbacks.
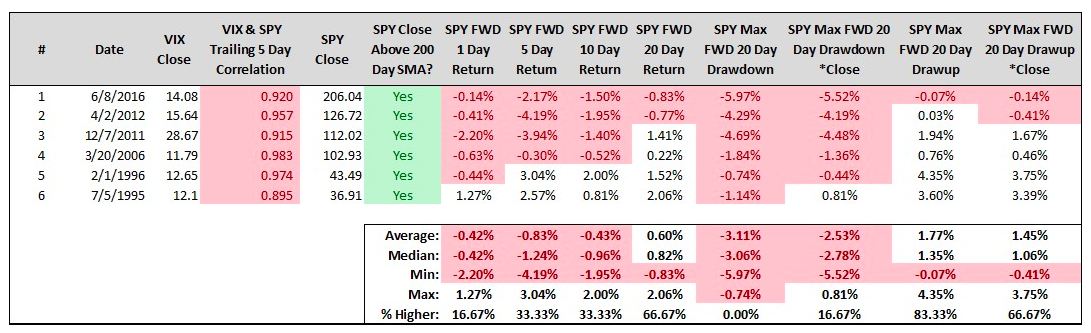
Second, the trailing 5-day correlation between the Volatility Index (VIX) and SPDR’s S&P 500 Index Fund (SPY) closed today at 0.90. This marks ascending nervousness directly alongside ascending price action, perhaps a form of hedging into higher prices (the old “protection is cheap” narrative). I interpret this as market participants’ way of demonstrating skepticism re: said ascending price action. Extreme spikes in this trailing 5-day correlation have preceded turbulence at some point over the forward 1 month more often than not. When identifying all trading days where the 5-day correlation between VIX and SPY was 0.90 or greater, and SPY closed above its 200 day simple moving average, we’ve experienced maximum forward 20-day drawdowns of -4% or worse in each of the last 3 samples – the bulk of which occurred in the forward 5 trading sessions following the signal date.
If we look at the forest, rather than the trees, and think well beyond December, the behavior of market participants in November left some interesting clues regarding what could unfold over the forward one year.
continue this article reading on the next page…


