Almost four years ago I was lucky enough to stumble upon the work of Wayne Whaley, a piece titled “Planes, Trains and Automobiles, A Survey of Momentum Thrust Signals”, which won the Charles H. Dow award in 2010. If you’ve read this piece, then you undoubtedly understand Wayne Whaley’s brilliance. If you’re unfamiliar with Wayne, then you’re missing out on one of the best quantitative analysts alive. Either way, keep reading for a better understanding of one of the best seasonal barometers and signals of forward stock market returns.
The “TOY Story” You Should Be Watching
In March of 2012 Wayne set out to identify the “King Pin of seasonal barometers”. Wayne stated “I implored my computer to take a few seconds to exhaustively study S&P performance over every time period of the year and determine which time frame’s behavior was proprietor of the highest correlation coefficient relative to the following year’s performance.” What he found was that the performance of the S&P 500 Index over the two-month time period from November 19th to January 19th was remarkably effective in predicting the forward looking twelve month returns for the index, specifically from January 19th to the following January 19th. Wayne decided “Since this two-month time period (Nov19-Jan19) extends across the Turn of the Year (TOY) and encompasses the gift giving season, I have coined it the ‘TOY Barometer’.”
And like that, the “TOY Barometer” was born.
The “TOY Barometer” is calculated by measuring the S&P 500 Index’s price-only return from the close on November 19th (or the preceding Friday’s close if the 19th’s on a weekend) through the close on January 19th of the following calendar year (or the preceding Friday’s close if the 19th is on a weekend). “TOY Barometer” price-only market returns that exceed 3% are considered “bullish” signals, which historically suggest the S&P 500 may be headed to “infinity and beyond”. “TOY Barometer” returns that fall between 0%-3% are considered “neutral” signals and have far more normalized returns. “TOY Barometers” that happen to be negative are considered “bearish” signals and tend to be a harbinger of bad things to come for stocks. Just how successful has the “TOY Barometer” been in predicting the forward returns of the S&P 500? Let’s take a closer look…
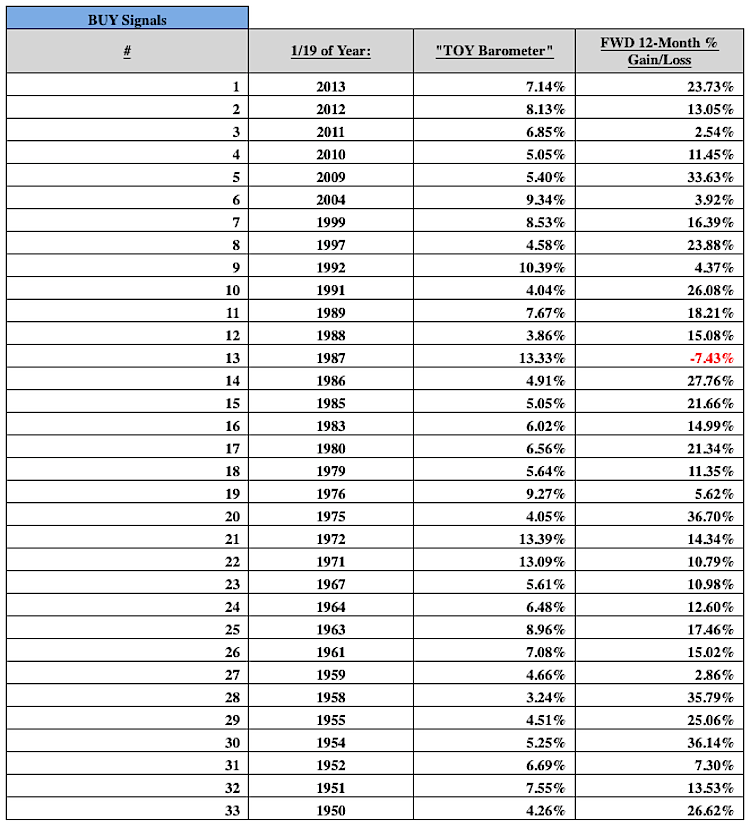
Bullish Signals
There have been 33 bullish “Toy Barometers” since 1950. 32 of these instances saw positive forward-looking twelve month returns for the S&P 500, a 96.96% win rate. Average and median market returns across all instances are 16.75% and 15.02%. The lone loser was 1987, which was an otherwise strong year to invest excluding one horrific trading session.
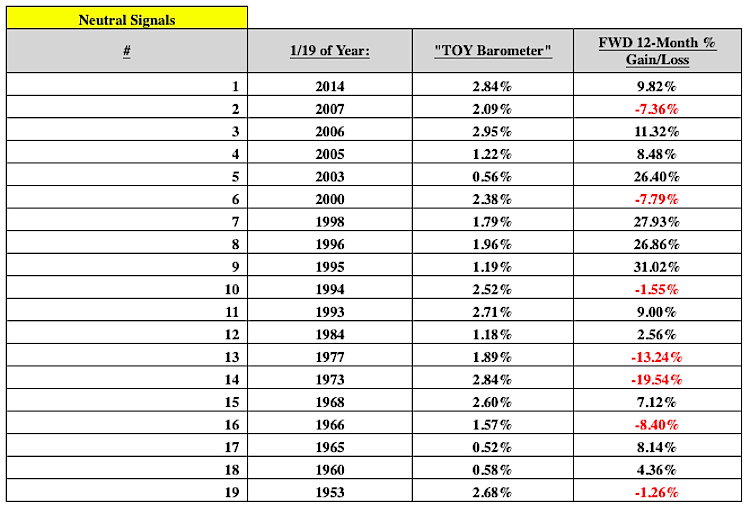
Neutral Signals
There have been 19 neutral “Toy Barometers” since 1950. Only 12 of these instances saw positive forward-looking twelve month returns for the S&P 500, a win rate of 63.15%. Average market returns fall to 5.99% and median returns are 7.12%. Of the 7 decliners, the worst occurred in 1973 with the S&P 500 declining by -19.54% through January 18th of 1974 (the 19th was a weekend).
continue reading about the TOY Barometer on the next page…

: Cup (and Maybe Handle) Watch")
 Reaches Important Price Support")

