On March 23rd of 2016 I wrote an article for See It Market titled “S&P 500 Bollinger Bands “Squeeze”: A Massive Move is Brewing”. (You can read that article by clicking here)
The article was centered on attempting to decode and understand the meaning behind an unprecedented “squeeze” in the S&P 500’s monthly Bollinger Bands. While I didn’t share anything magical or predictive, the S&P 500’s (INDEXSP:.INX) price action since March of 2016 is perfectly aligned with what I had envisioned at the time of the writing, that is “a move I envision being a consistent and persistent trend in one direction – as if you’re driving 100mph in “drive” or “reverse”. The S&P 500 chose “drive”, and since March of 2016 the S&P 500’s total return has increased 13 of 14 months for gains of 20.11% through May’s close. The point is not to brag or boast, but rather to reiterate the value in paying close attention when the price of an asset takes an extended nap over a 20-period time frame or more, (i.e. when the Bollinger Bands “squeeze”).
As of today’s close, the Russell 2000’s (INDEXRUSSELL:RUT) weekly closing prices the last 26 weeks are separated by just 60.13 points, or just 4.46%. This is the narrowest rolling 26-week high-low closing price range in my Russell 2000 database dating back to 1991. Therefore, the lack of deviation in closing prices since December 2016 has brought an unprecedented Russell 2000 Bollinger Bands squeeze on the “weekly” chart (see below).
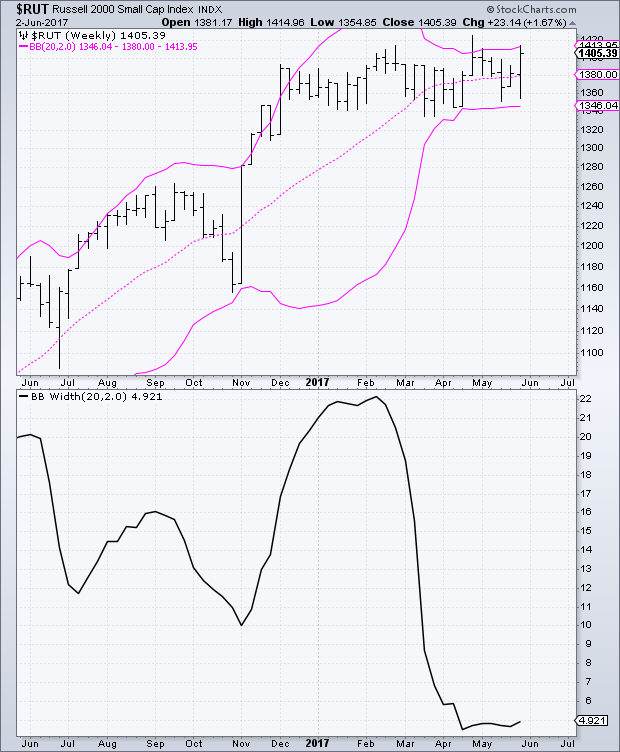
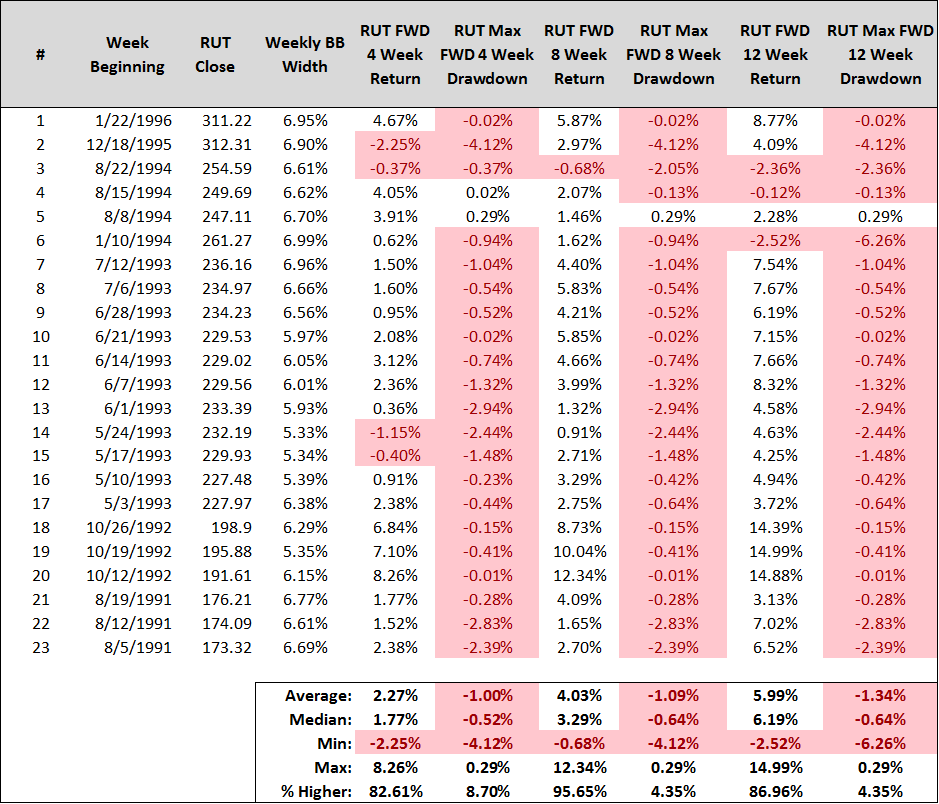
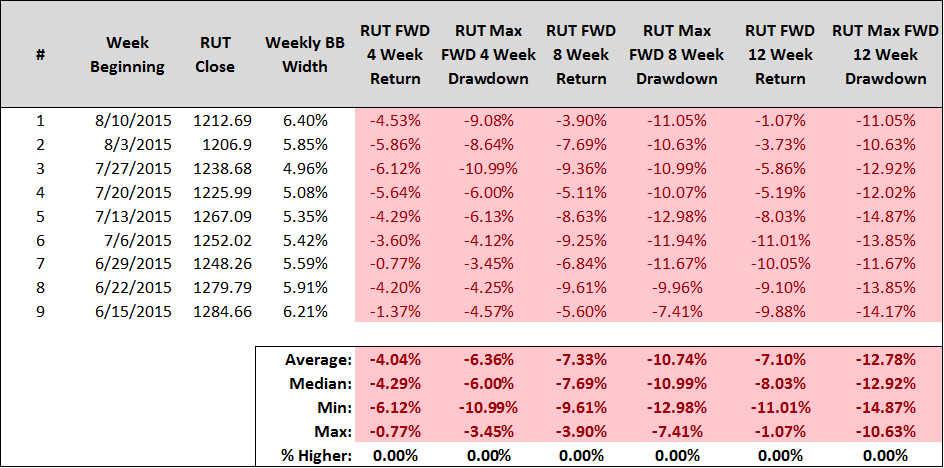
Bollinger Band Width computes the percentage between the upper and lower Bollinger Bands. For the week ending 4/21/2017, the Russell 2000’s Bollinger Band width established a new all-time low at just 4.47%. Since 1991, the average and median Russell 2000 weekly Bollinger Band width readings are 17.62% and 14.79%. Combing back through history, I can only identify 42 calendar weeks where Bollinger Band width ended the week below 7%, an occurance rate of just 3%, and this includes overlapping samples. To say this is rare is an understatement. Identifying the Russell 2000’s historical returns and maximum drawdowns over the forward 4, 8, and 12 weeks from these 42 weeks provides something for both Bulls and Bears and draws our attention to just two prior time frames: the early to mid 1990’s, and the summer of 2015.
Early to Mid 1990’s
In the early to mid 1990’s, weekly Bollinger Bands width compressions were bullish markers on a forward looking basis. The Russell 2000’s forward 4, 8, and 12 week returns were higher more than 80% of the time across all time frames. Additionally, there was virtually no painful drawdowns along the forward 12 weeks. Only 1 sample saw a maximum drawdown of more than 5% over the forward 12 weeks. In the early 1990’s, after the Russell 2000 took a nap for 20 weeks, it woke up and headed north.
2015
In 2015, the weekly Bollinger Band width compression for the Russell 2000 was an entirely different story. Forward 4, 8, and 12 week returns were nothing but red. In 2015, after the Russell 2000 took a nap for 20 weeks, it woke up on the wrong side of the bed.
Will the current weekly Bollinger Band width compression in 2017 resolve like the compressions in 2015, or like those from the 1990’s? As always, nobody definitively knows. When the price of an asset parks itself in neutral through a prolonged, narrow, trading range, it’s notoriously difficult to forecast is next move. Often times these trading ranges are continuiation patterns, think the occurances from the early to mid 1990’s, while other times they’re reversal patterns, think 2015’s massacre where the Russell 2000’s primary trend reversed from “Bullish” to “Bearish”.
However, while a “squeeze” in Bollinger Bands doesn’t provide any directional certainties, it does provide an element in certainty regarding resolution. If we identify the forward 4, 8, and 12 week returns following the 42 calendar weeks where Bollinger Band width ended the week below 7% not for the Russell 2000, but instead for the Russell 2000’s weekly Bollinger Band width, we can identify that the forward 12 week returns for Bollinger Band width are higher 100% of the time for average and median increases of 123.15% and 84.11%.
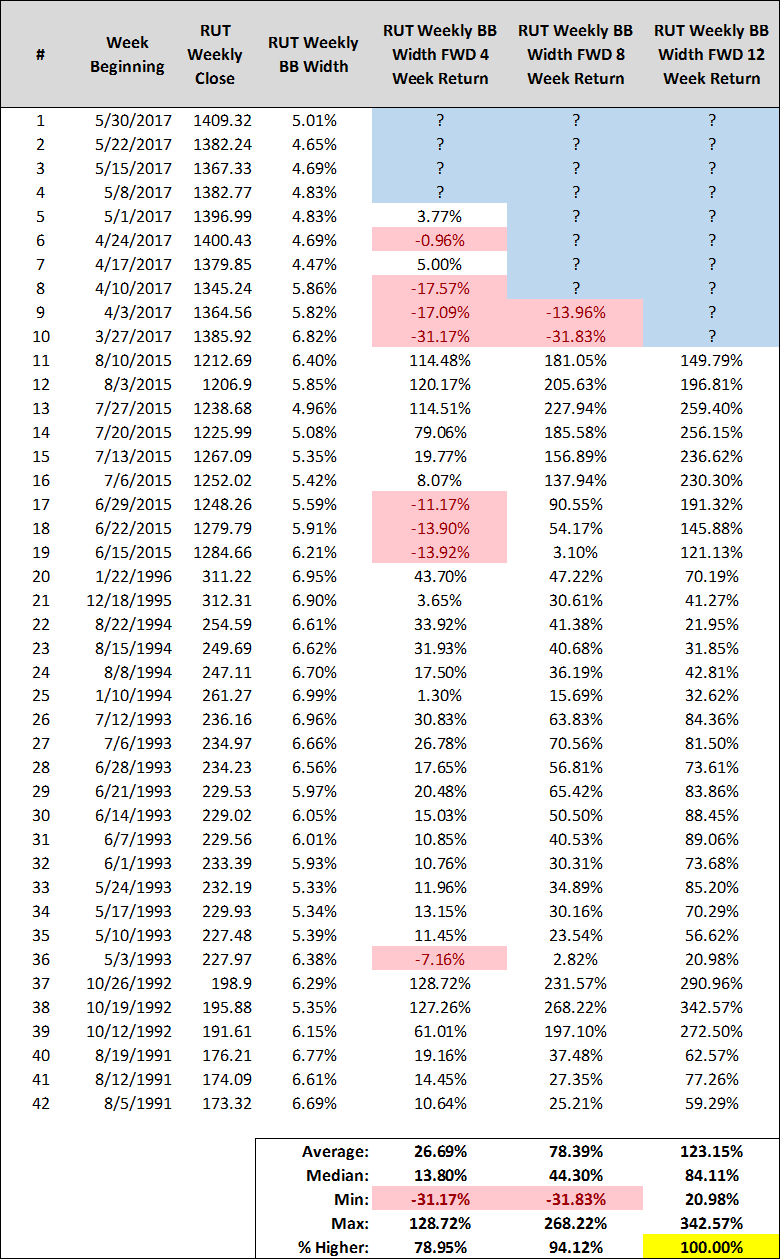
Therefore, history would suggest it’s highly likely that we have resolution within 12 weeks, or by the week ending 8/25/2017. How does Bollinger Band width potentially increase 123% over the forward 12 weeks from today? Easy, with the price of the Russell 2000 sustaining above or below its upper or lower weekly Bollinger Bands, which currently sit at 1,413.95 and 1,346.04. With today’s close at 1,405.39, and with this week marking a massive bullish outside reversal week that brokeout above the month of May’s high, the Russell 2000 has an opportunity to hurdle above its upper weekly Bollinger Band over the week(s) ahead.
As always, we also must be conscious of the head fake, or the scenario where price appears to breakout in one direction, only to then completely reverse course. This is accomplished by executing a written trade plan that clearly defines your trades entry and exit prior to placing your trade. Regarding the entry, one trigger is to use a weekly close above the upper band, or a weekly close below the lower band, as your signal to initiate a position long or short the Russell 2000. Regarding your exit, predefined profit targets are a terrific way to manage the risks associated with “greed”, and managing risk to your principal can be accomplished by using a trailing stop at and around the 20-week simple moving average (middle of the Bollinger Bands). This will define risk and hedge against a false start, or whipsaw.
As long as you exercise maniacal robotic like discipline, you can ensure you’re on the right side of the next massive move for the Russell 2000, a move I once again envision being a consistent and persistent trend in one direction – as if you’re driving 100mph in “drive” or “reverse”. We’ll find out if the Russell 2000’s ready to “drive” next week.
Thanks for reading.
Twitter: @SJD10304
The author may hold positions in related securities at the time of publication. Any opinions expressed herein are solely those of the author, and do not in any way represent the views or opinions of any other person or entity.

 and Russell 2000 (IWM)")


 and Russell 2000 (IWM)")
