First, I have some deja vu back to November of 2016, given how November of 2017 unfolded.
A “Bullish Outside Reversal Month” for the Russell 2000 and SPDR’s Industrial Select Sector (XLI), absolutely exploding Financials and Regional Banks via the SPDR’s Financial Select Sector (XLF) and SPDR’s S&P Regional Bank Index (KRE), the Dow Jones Transports (IYT) rocketing, and an all-time high monthly close for the S&P 500. This all occurred in November of 2016, and has now occurred again in November of 2017.
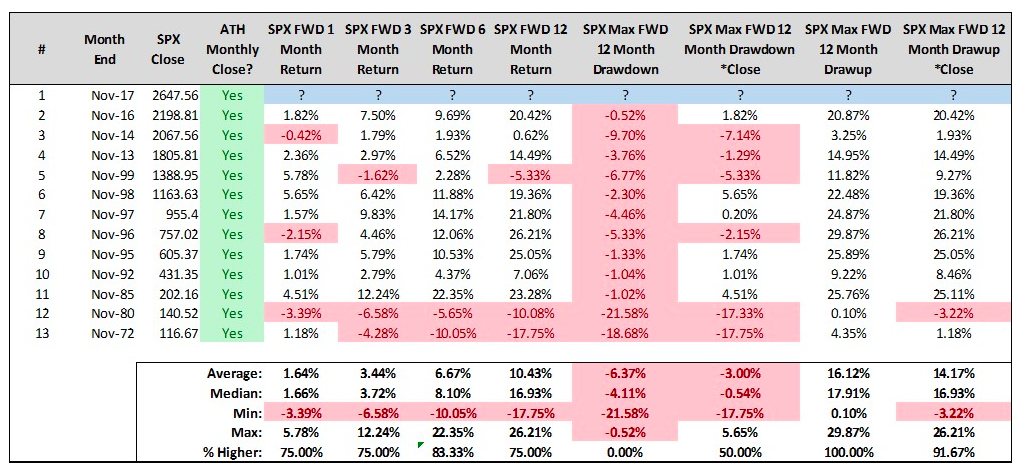
This is not to suggest 2018 will behave anything like 2017, but it is to suggest that the behavior of market participants is hardly any different than exactly one year ago. Broadly speaking, participants remain incredibly eager buyers of equities, any and all narratives fit. This behavior paints the monthly chart of the S&P 500 as a beautiful primary uptrend with nothing but air above (there’s no known resistance at the moment). Interestingly, when the S&P 500 closes the month of November at an all-time high, its forward 6-month returns have been higher 10 samples in a row and 10 of 12 overall. As they say, “strength begets strength”.
Looking at the Russell 2000 via the iShares Russell 2000 Index (IWM), November recorded as a “Bullish Outside Reversal Month” (BORM), or a calendar month with a lower low, higher high, and higher close than the prior calendar month. Since the lower low came first in November, my interpretation is that market participants demonstrated a salacious appetite to buy IWM’s constituents when they went on sale, analogous to a ridiculous Black Friday stampede at your local Wal-Mart. Since inception, there’s now 17 BORM’s for IWM, and 13 of the prior 16 saw IWM finish higher 1 year later for median returns of 11.91%.

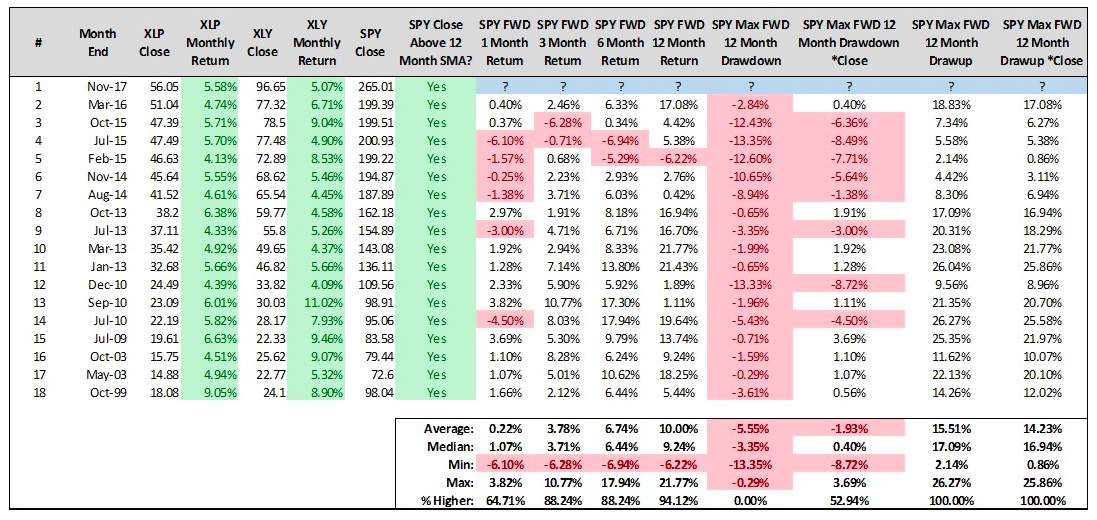
Lastly, November was a big month for the consumer sectors of the S&P 500 with the SPDR’s Consumer Staples Select Sector (XLP) and SPDR’s Consumer Discretionary Select Sector (XLY) both gaining more than 4%. Since inception, there’s now 18 calendar months where both XLP and XLY gained 4% or more and SPY closed the month above its 12-month simple moving average. In the prior 17 samples, the price of SPY closed higher over the forward one year 16 times for median returns of 9.24% . Overlapping samples certainly play a role here, but the point remains – XLP and XLY sent a positive omen for SPY’s prospects over the coming year.
After a year like 2017, the easiest and most comfortable path is to sell ’em all and turn your unrealized gains into realized gains. The harder and more uncomfortable path is to “be right and sit tight”, or to continue to invest in the purest of forms. I think those who choose the harder and more uncomfortable path will continue to be rewarded over time. And if I’m wrong, well that’s what my risk management plan is for.
Thanks for reading.
Twitter: @SJD10304
The author may hold positions in related securities at the time of publication. Any opinions expressed herein are solely those of the author, and do not in any way represent the views or opinions of any other person or entity.


