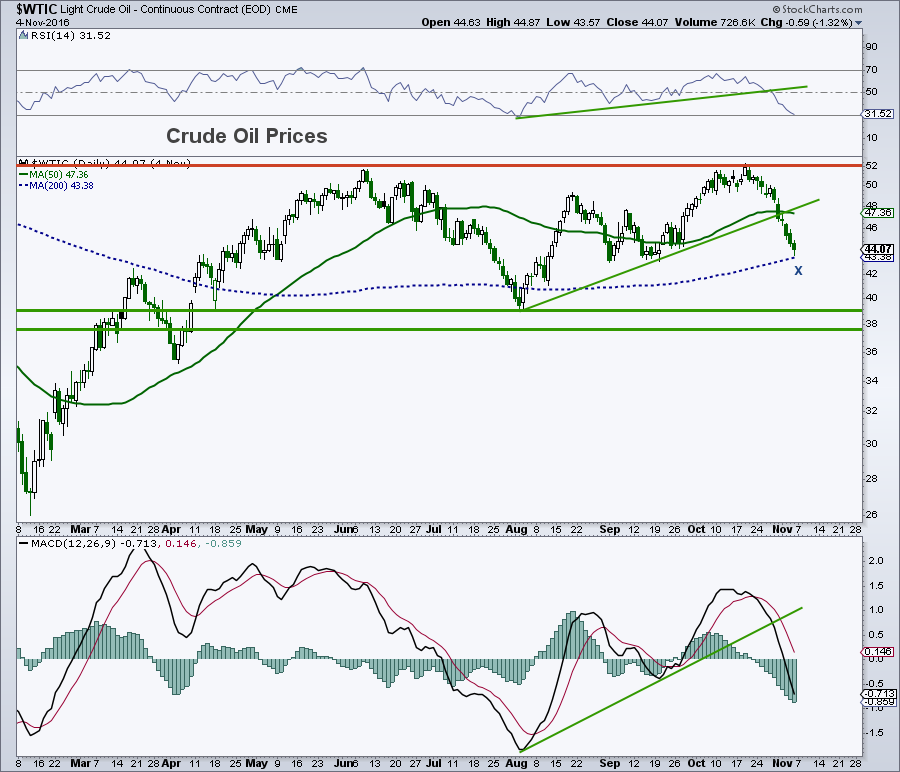
Crude oil prices have pulled back sharply over the past couple of weeks. The late October / early November crude oil decline comes on the heels of a stiff rejection at the recent highs ($52ish) last month.
While the chart pattern when crude was at the highs was looking very good, and many analysts (including some technicians) were looking for a major breakout, I had my doubts.
Why? Because understanding price action requires use of multiple tools. This is exactly why I add in a layer of analysis that includes the COT report. The smart money commercials were getting more bearish on crude oil as oil prices were attempting to break out of their range. At the same time, large speculators (not so smart money) were getting very bullish. As I have said many times with most commodities, this is not a good combination.
So What Now?
For now, WTI crude oil remains stuck between chart resistance in the low $50’s and chart support in the $42/$39 area. Daily momentum has broken its uptrend and there is still room before the 14-day RSI cycles into oversold territory. I am neutral here.
Thanks for reading.
Further reading: S&P 500 Chart Support Levels To Watch
Twitter: @MarkArbeter
The author does not have a position in mentioned securities at the time of publication. Any opinions expressed herein are solely those of the author, and do not in any way represent the views or opinions of any other person or entity.


