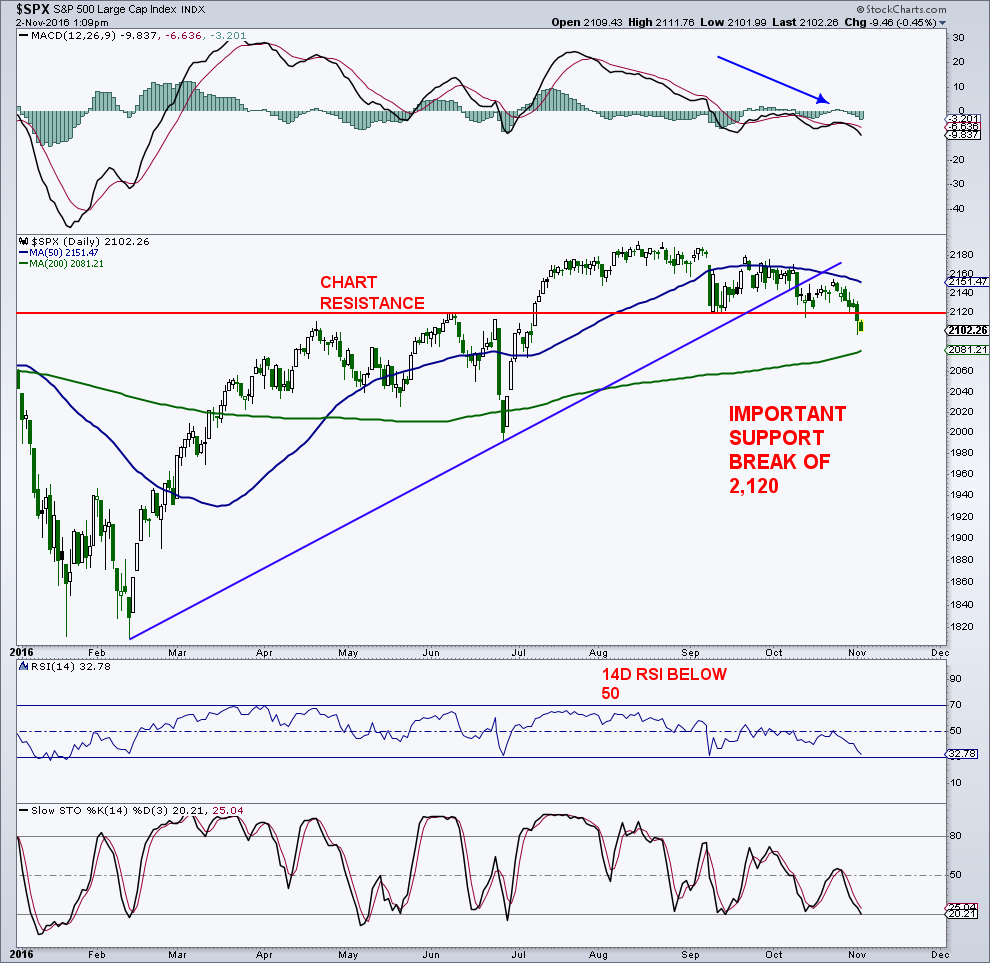
The S&P 500 Index (INDEXSP:.INX) has taken out key chart support at 2,120 so our short-term bearish call is finally playing out.
S&P 500 Chart Support Levels and Indicators To Watch
The first area of potential chart support comes from the slowly rising 200-day moving average at 2,081. The price actionaround the 200-day could be very telling as this could end up being another Brexit-type stock market low.
Notice what happened in late June: the “500” under cut the 200-day moving average for one day before reversing higher. This type of price reaction may also happen from a lower level if the 200-day does not hold. Below 2,080, the next potential S&P 500 chart support level lies in the 2,040/2,050 zone. A 38.2% retracement of the rally from February to August targets the 2,050 region while there is a gap on the chart down near 2,040. Below 2,040 opens the door for a full retest of the Brexit lows near 2,000.
Please note that this is an excerpt from my Premium Newsletter. You can contact me at arbetermark@gmail.com if interested.
Daily momentum remains bearish with the MACD on a sell signal and below zero. As I have said, most price damage happens in this configuration. The 14-day RSI is approaching oversold territory (30 or below) which may limit the downside. As I have been saying, I would use a layering approach to increase equity exposure as this takes the emotion out of your decision making process. The next buy area on the S&P 500 is near the 200-day at 2,080, with other levels coming in at 2,040/2,050 and 2,000. I do think that once the stock market turns higher, we could see another pretty good rip to the upside. Remember, the stock market still has a very favorable seasonal stretch ahead of us.
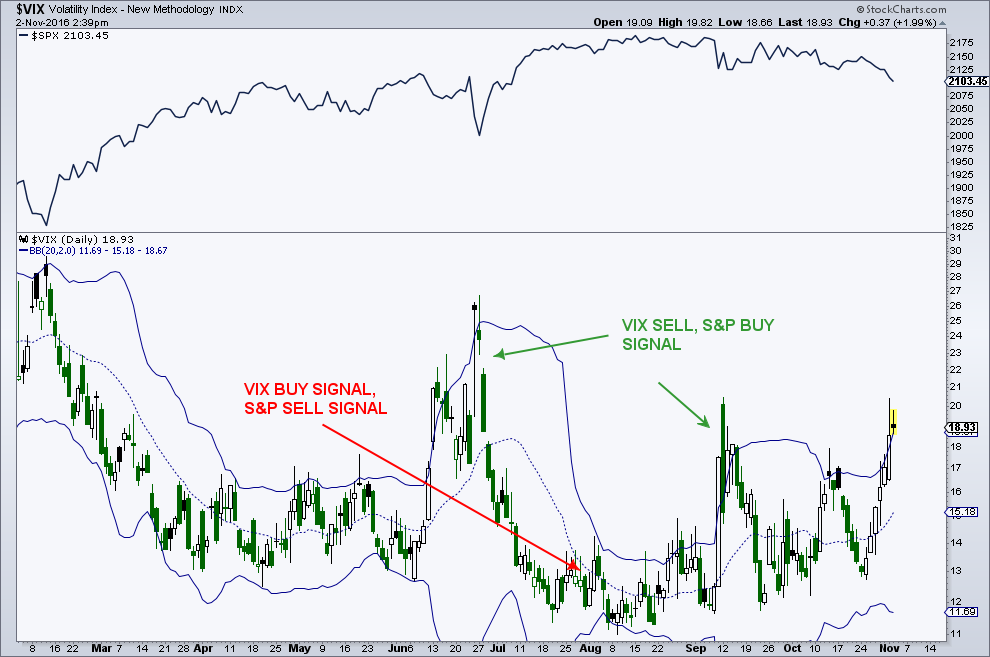
Volatility Index Signal (a 3-step process)
One important signal we can get from the Volatility Index (INDEXCBOE:VIX) is its relationship to its Bollinger Bands (BB). A VIX sell / S&P 500 buy signal is a 3-step process. First day, the VIX must close outside the upper BB. The second day, the VIX must close back inside the bands. The third day, the VIX must close lower than the second day. At this point, the VIX is outside the upper band so the first step is upon us. The 3-step process must occur on consecutive days, otherwise, there is no signal.
Also read: The Troops Are Bailing On The Generals
Conclusion remains the same: Layer into weakness as a way to increase equity allocations. I do not know where the bottom is and no one else does either until AFTER the fact. The rally out of this current mess should take the S&P 500 to new highs by end of year, and to the 2,300 to 2,500 region in the1st half of next year. Thanks for reading.
Twitter: @MarkArbeter
The author has a long position in S&P 500 related securities at the time of publication. Any opinions expressed herein are solely those of the author, and do not in any way represent the views or opinions of any other person or entity.

 Rolling Over At Key Fibonacci Level?")


