While the mega cap stock market indices continue to drift into a state of oblivion, there continues to be telltale signs of weakness under the surface. Once again, and similar to the early part of 2015, the generals (mega cap stocks) are holding up the major indices while the troops (small and mid cap stocks) are starting to scurry for cover.
I wrote about this a few times in 2015 before the major stock indices cracked. Today we’ll revisit this theme in my stock market update. We’ll look at the price action of the Russell 2000 Index (INDEXRUSSELL:RUT) and S&P 500 Index (INDEXSP:.INX)
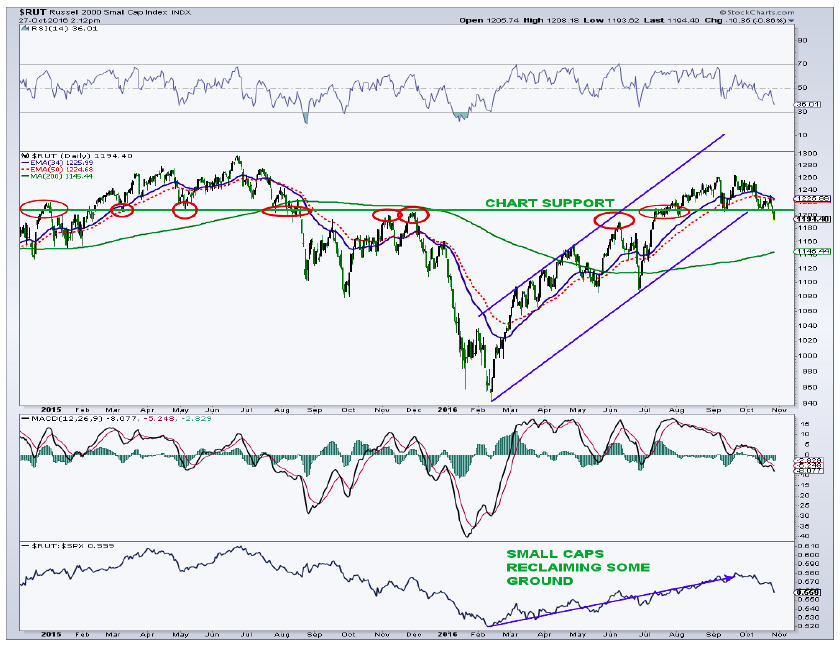
The Russell 2000 is breaking down from either a double top or a complex head-and-shoulders top. More importantly, the index is back below the key area between 1,200 and 1,210. This area, as I talked about recently, has been very important for the index as it has acted as both support and resistance many, many times over the past couple of years.
Please note that excerpts of this post came from my Premium Newsletter. You can contact me at arbetermark@gmail.com if interested.
Based on the size of the complex top, the Russell 2000 (RUT) could see a measured move down to the 1,150 area. Not surprisingly, the rising 200-day moving average, currently at 1,145, will most likely be in the 1,150 zone during the next month or two. The RUT outperformed the “500” from February until late September, but has been lagging fairly well over the past month.
It’s also worth noting that the S&P MidCap 400 ETF (MDY) is also breaking down from a complex top and based on the size of the top, we could see a measured move down to the 260 region.
Another way to analyze the risk on/risk off trade is to compare the performance of the equal weighted (EW) S&P 500 to the “500” itself. As I have written many times, it is more preferable for the overall market when the higher beta issues are outperforming their larger brethren. In bullish times, institutions seek out those issues that can provide more bang for the buck.
These positions are generally smaller stocks with high earnings and revenue growth. On the other hand, when institutions want to play a little defense, that is go risk off, as they generally seek higher yielding, low beta mega caps.
The ratio of the equal weighted “500” vs. the “500” shows that the smaller stocks bottomed out vs. the mega caps in the latter part of January. The troops led the generals until late April with the ratio drifting sideways until early October. During this month, the EW “500” has underperformed the “500,” showing a clear risk off/defensive move. While this ratio is still consolidating, it is not far from breaking down below the late June lows when the S&P 500 was closer to the 2,000 level. Continued deterioration here must be considered a bearish overall condition for the stock market.
Come to think of it, this condition is very similar to 2015 when the FANG (FB, AAPL, NFLX, GOOGL) stocks were all the rage. The 2016 version might replace AAPL with AMZN, but the point is clear. The troops are leaving the station while a few monster moves in a few stocks have certainly kept the NASDAQ humming, and have certainly not hurt the S&P 500.
Remember, the NASDAQ 100 (QQQ’s) made a new recovery high in late 2015 while the “500” did not. Many thought this outperformance was bullish, but when led by only a few stocks, it did not end well. The same can be seen today with the QQQ’s making new highs recently while the S&P 500 meanders and the smaller stocks break down. While I’m not saying we will see a repeat of 2015/early 2016, the similarities do raise a yellow flag.
Checking in on the breadth of the NASDAQ, one can clearly see deterioration despite an index that just recently hit all-time-highs. Since the middle of July, the percentage of NASDAQ stocks above their 50-day average has fallen from 73% to 36% as of Wednesday’s close. There was a similar deterioration in late 2015. However, the percent above their 200-day average is at 57% vs. 30% in late 2015. So from a longer-term perspective, the index is in much better shape than it was before the meltdown early this year.
As I have been saying far too often, the 2,120 area for the S&P 500 remains key chart support on a closing basis. Both the bulls and the bears know the importance of this level as it represents the area from which the “500” broke out from on its way to all time highs. A strong close below this important region could open the door for a very quick decline. Initial support comes in from the slowly climbing 200-day simple average at 2,077 while a 61.8% retracement of the rally since late June targets 2,069. Below this general area would open the door for a retest of the late June lows in the 2000 zone.
Daily momentum is still indicating that caution is warranted. The 14-day RSI is still below 50 (currently 46) but would not need a whole lot of price strength to get back into the bullish (above 50) zone. The daily MACD remains in negative territory, and is flirting with another bearish cross below the signal line.
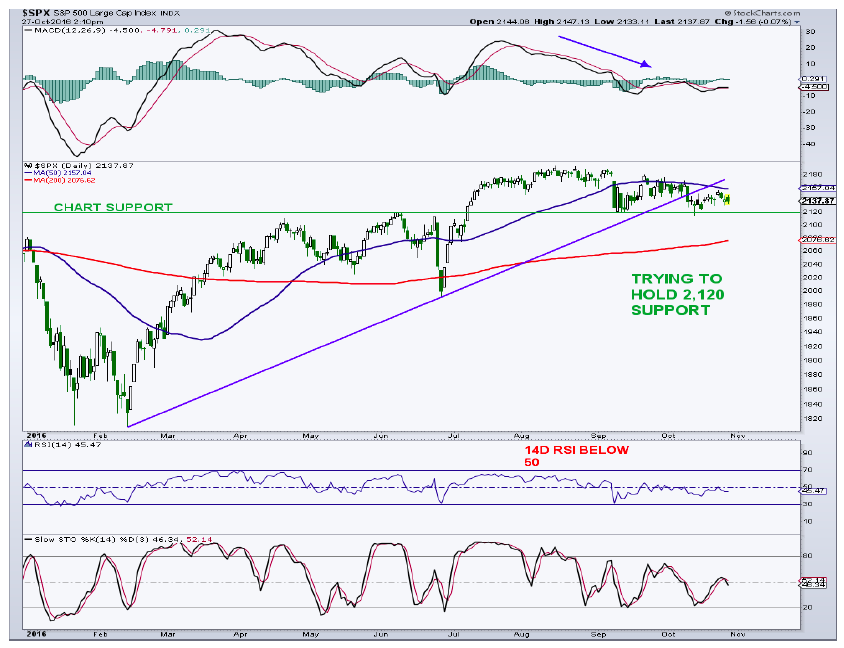
Same Conclusion: Near-term, volatility is back. I would continue to use a layering approach on any more weakness with 2,120, 2,100, and 2,070 as focus areas to increase equity allocations. Looking out, I see the S&P 500 reaching the 2,300 to 2,500 region later this year or in the first half of 2017.
Thanks for reading.
Twitter: @MarkArbeter
The author has a long position in S&P 500 related securities at the time of publication. Any opinions expressed herein are solely those of the author, and do not in any way represent the views or opinions of any other person or entity.


