EURO
Annual inflation in the Eurozone in March was minus 0.1 percent, following minus 0.2 percent in February. Prices are still falling, and are a long way from the ECB’s target of close to two percent. The bank expects inflation to be only 0.1 percent this year.
Core inflation, however, was one percent in March, versus 0.8 percent in February. Maybe the collapse in energy prices is suppressing the headline inflation number after all.
That said, this is one more data point bolstering doves’ voices within the ECB. The question is, did Mario Draghi, ECB president, go all in on March 10th? The euro is definitely acting like he has. Intra-day, between March 10th and April 1st, it rallied 5.7 percent.
With this, the euro has reached a critical juncture. On Friday, it retreated from hitting a high of 114.38. This is an area of strong resistance going back to January 2015. A breakout here would be massive, but with very low odds right at this moment.
Particularly on a daily chart, the euro remains grossly overbought, with Thursday producing a shooting star. This came in the wake of a long-legged doji on Wednesday. The currency is tired. Time to test support. The likely area of interest lies just under 111, which also approximates the 50- and 200-day moving averages. By the way, for whatever it is worth, the Euro just completed a golden cross.
Euro COT Report Data: Currently net short 63.8k, down 2.2k.Euro

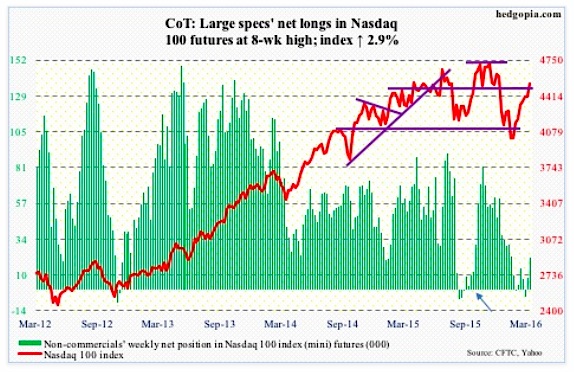
NASDAQ 100 INDEX (mini)
A day after breaking out of its 200-day moving average on Tuesday, the Nasdaq 100 flashes a shooting star just outside the upper Bollinger Band. Come Friday, the index rallies 1.1 percent to essentially nullify the potentially bearish candle.
Nonetheless, should weakness set in, it will be interesting to see if 200-DMA (4420) generates buying interest, followed by horizontal support at 4350 going back to November 2014.
If Tuesday and Wednesday this week are an indication, there is reason to be hopeful. QQQ, the PowerShares Nasdaq 1000 ETF, hauled in $549 million on those two days, more than offsetting the $468 million withdrawn in the week ended Wednesday last week (courtesy of ETF.com).
Nasdaq 100 COT Report Data: Currently net long 21.1k, up 13.2k.NDX
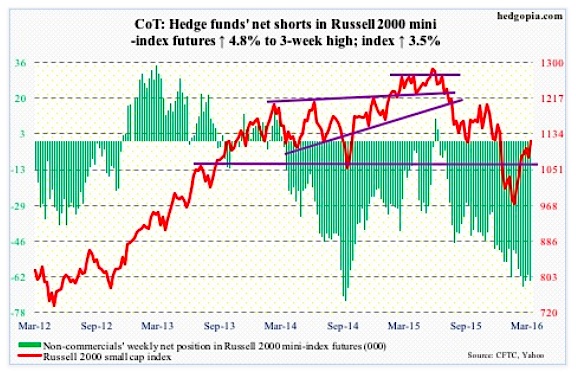
RUSSELL 2000 mini-INDEX
Small-cap bulls got a lot to cheer about this week.
Thanks to Ms. Yellen, the Russell 2000 on Tuesday broke out of three-week congestion. It is now past 1080 resistance. Last week saw a daily bearish MACD crossover, which was negated this week.
The index peaked last June, a month after the S&P 500 did. A trend line drawn from that peak descends to 1140, which is where its 200-day moving average lies. That is another two percent from here.
Does this run that began on February 11th have enough juice left to see small cap stocks test that resistance? If money starts flowing in, anything is possible. Short interest in IWM, the iShares Russell 2000 ETF, has gone up 8.5 percent in the past month to 111.1 million shares (as of mid-March), which could get squeezed in the right circumstances.
However, in the week ended Wednesday, IWM lost $256 million. This followed $1.4 billion in inflows in the prior week (courtesy of ETF.com).
Non-commercials continue not to buy into the current rally, and they have been wrong so far.
Russell 2000 COT Report Data: Currently net short 63.7k, up 2.9k.RUT
US DOLLAR INDEX
Reading between the lines in the afore-mentioned speech, it was clear Ms. Yellen would like a lower dollar. At least near-term, she has gotten exactly that. From Monday’s close to Thursday’s intra-day low, the US Dollar Index dropped 1.7 percent.
Longer-term trends are probably going her way as well. Monthly momentum indicators have turned down, with a fresh MACD bearish crossover.
The issue is what is likely to happen near-term.
The 1.6-percent drop this week has dropped the US Dollar Index right on a rising trend line from last May. On Thursday, it tested the lower Bollinger Band, before bouncing a tad. Friday produced a long-legged doji. The 10-day moving average is beginning to go flat.
In an imminent rally, 97 is where bulls and bears are set to lock horns. Besides horizontal resistance, this is where both 50- and 200-day moving averages converge, with a fresh death cross to boot.
Non-commercials’ net longs have gone flat the past three weeks.
US Dollar COT Report Data: Currently net long 17.8k, up 76.USD

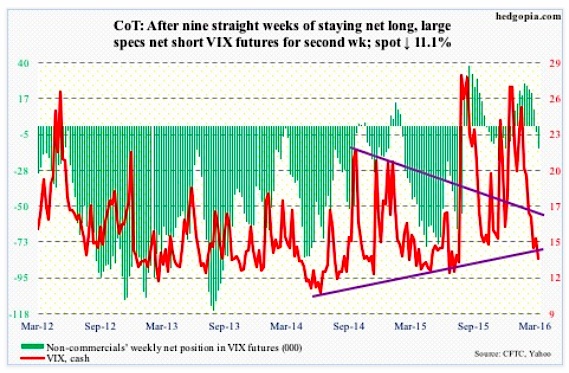
VIX Volatility Index
Not surprisingly, spot VIX got slammed on Tuesday from right underneath its 20-day moving average. Friday saw a repeat of that.
That said, a bullish MACD crossover looks imminent on a daily chart of the VIX.
Two weeks ago, the VIX to VXV ratio dipped below 0.8 to .782. Last week was .807, and this week .794. The spring is coiled.
VIX COT Report Data: Currently net short 13.8k, up 9.8k.VIX
Thanks for reading.
Further Reading From Paban: “Is The Federal Reserve Targeting A Weaker Dollar?“
Twitter: @hedgopia
Read more from Paban on his blog.
The author may hold positions in mentioned securities at the time of publication. Any opinions expressed herein are solely those of the author, and do not in any way represent the views or opinions of any other person or entity.


