The following is a recap of The COT Report (Commitment Of Traders) released by the CFTC (Commodity Futures Trading Commission) looking at COT report data and futures positions of non-commercial holdings as of March 29th (released on April 1). Note that the change in COT report data is week-over-week.
Macro Commentary:
The back and forth between the two camps within the FOMC continues. Last week, several members used public forums to express hawkish opinions in regard to the projection of interest rates going forward. James Bullard, St. Louis Fed president, was quoted the most.
At the Economic Club of New York this Tuesday, Janet Yellen, Fed chair, vehemently pushed back at those hawkish voices.
To be fair, Ms. Yellen did not say substantially different from her dovish post-FOMC press conference on March 16th. But she probably felt the need to reiterate herself, with some added color, in order to silence the growing chorus of hawkish voices.
She has succeeded so far. Since her Tuesday speech, stocks are up (wealth effect), the dollar is down (oil up; and positive for exports), Treasury yields down (positive for housing, etc.), among others.
As the two camps go about freely expressing opinion in public appearances, markets increasingly are getting whipsawed. Too much transparency out there.
There are a host of major economic releases next week.
The advance report on February’s durable goods was published on March 24th. Revised estimates plus non-durable goods data come out on Monday. Preliminarily, orders for non-defense capital goods ex-aircraft – proxy for business capital expenditures – fell 1.8 percent in February to a seasonally adjusted annual rate of $67.4 billion, and are down for 13 straight months on an annual basis. They peaked at $74 billion in September 2014.
On Tuesday, we get JOLTS (February) and the ISM non-manufacturing index (March).
Job openings rose by 260,000 in January month-over-month to 5.54 million. They peaked at 5.79 million last July.
Unlike its manufacturing cousin, non-manufacturing has been faring much better. That said, services are in deceleration as well. February was 53.4, down from 59.6 last July. Similarly, February orders came in at 55.5, down from 62.6 last July.
FOMC minutes for the March 15-16 meeting are published on Wednesday. Ms. Yellen’s Tuesday speech has probably trumped the significance of these minutes.
On Thursday, consumer credit for February is published. January was up 6.5 percent y/y to a seasonally adjusted annual rate of $3.54tn. Most notably, over the years, student loans have soared to $1.32 trillion, and auto loans to $1.04tn.
Seven FOMC members are scheduled to speak during weekdays, including Ms. Yellen (at 5:30 PM on Thursday).
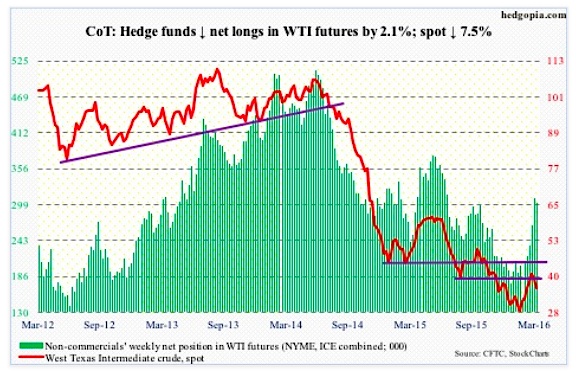
CRUDE OIL
Spot West Texas Intermediate crude oil has come under pressure since it was rejected at its 200-day moving average two weeks ago. On a weekly chart, there is plenty of room for crude oil prices to continue heading lower.
Should the trend continue, 34.50 is the line in the sand. Spot WTI crude oil broke out of it nearly a month ago. If the breakout is real, there should be plenty of buy orders waiting to pounce on the opportunity. This price point is also about where the 50-day moving average lies.
On the fundamental front, the momentum in buildup of crude oil inventory continued in the week ended March 25th. Stocks rose by 2.3 million barrels to 534.8 million barrels – now up 52.3 million barrels in the past 12 weeks. Massive!
Bloomberg, by the way, reported that the all-time high was reached in 1929 when stocks hit 545 million barrels.
Crude oil imports fell by 636,000 barrels per day to 7.7 million b/d. There were other positives as well.
Both gasoline and distillate stocks fell – the former by 2.5 million barrels to 242.6 million barrels, and the latter by 1.1 million barrels to 161.2 million barrels. Gasoline stocks have declined by 16.1 million barrels in the past six weeks.
Refinery utilization rose by two percentage points to 90.4 – a 10-week high.
Crude oil production, too, fell by 16,000 b/d to nine mb/d. Production reached a record 9.61 mb/d in the June 5th (2015) week.
Crude Oil COT Report Data: Currently net long 302k, down 6.6k.WTI
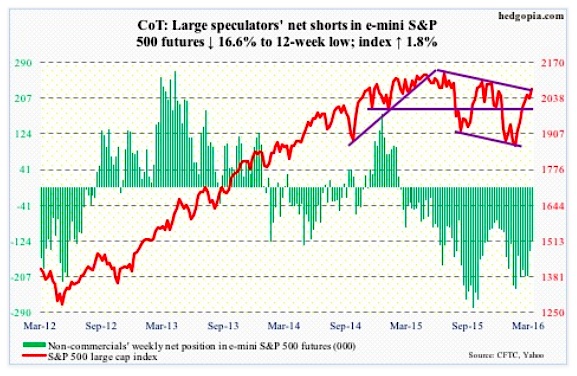
E-MINI S&P 500
Some good and bad news for stocks. On Tuesday, the S&P 500 rallied 0.9 percent to retake 2040. Longs, however, used that as an opportunity to cash in. SPY, the SPDR S&P 500 ETF, lost $1.4 billion in that session. For the week ended Wednesday, it lost $381 million (courtesy of ETF.com).
Lack of inflows has been a persistent problem in the current stock market rally, which started on February 11th. Since the week ended February 10th, $10.5 billion has left U.S.-based equity funds, with $2.6 billion leaving in the week ended Wednesday (courtesy of Lipper).
What would the magnitude of the rally be if flows had cooperated? Makes you wonder. Also wondering if margin debt saw a sizable pickup in March. The S&P 500 jumped 6.6 percent in the month.
February saw another decrease in NYSE margin debt, down $11.9 billion m/m to $435.8 billion. Since the April 2015 peak of $507.2 billion, it is now down $71.3 billion. It is headed the wrong direction, and needs to reverse direction if the rally since February 11th is real.
Thus far, price action remains solid. A potential problem for stocks: The index is right at the declining trend line from last July.
S&P 500 COT Report Data: Currently net short 122.1k, down 24.3k.SPX
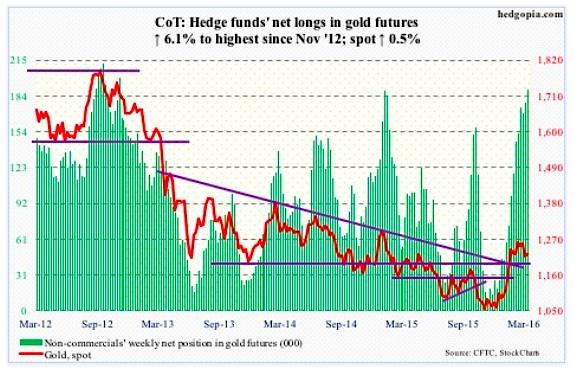
GOLD
On Tuesday, the day Ms. Yellen delivered her uber-dovish speech, spot gold jumped 1.7 percent. Shorts in GLD, the SPDR gold ETF, probably got creamed in that session. As of the middle of March, short interest stood at 13.4 million shares – a five-month high and up 52 percent this year.
Rather revealingly, on Tuesday and Wednesday combined, $175 million left the Gold ETF GLD (courtesy of ETF.com).
There is room to rally on a daily chart, but Gold prices are not gaining traction. Inflows are needed.
The good thing, from gold bugs’ perspective, is that in the recent sell-off the 1180 level has so far not even come close to being retested. The metal is finding support at 1200-plus, which is where the rapidly rising 50-day moving average finds itself.
Weekly indicators continue to want to go lower. Let us see if gold bugs step up to save daily support. On a monthly chart, after strong January and February, March produced a doji. Bulls and bears are on an even keel.
Gold COT Report Data: Currently net long 189.8k, up 11k.Gold
continue reading on the next page…


