One of the more frustrating trades this year has been the back-and-forth rallies and sell offs in the cannabis sector.
MSOS is the ETF stock ticker for US Cannabis. Since the beginning of 2024, has rallied to over $10.00 a share on news of decriminalizing cannabis only to fall back to $8.00 and now $9.00 a share once the news becomes more of a speculation.
One could say that cannabis has been the biggest political football, even more than bitcoin!
This past week Biden stated that the @TheJusticeDept is taking the next step to reclassify marijuana from a Schedule I to a Schedule III drug under federal law.
VP Harris chimed in with, “Currently marijuana is classified on the same level as heroin and more dangerous than fentanyl. We are finally changing that,” Harris said. “We are on the road to getting it done.”
On the road are the operable words.
This led us to have a look outside the Cannabis ETF MSOS and the basket of companies that are already involved with legalized pot, either medical or recreational or both.
In 2018, the CEO of Philip Morris (PM) said that the “company is keeping clear of the cannabis industry.” He also said that the company is “pushing to create a smoke-free future.”
Then in 2021, the company announced that they would join other cigarette producers that have already jumped into the cannabis industry.
In 2023, PM acquired for $650 million, an Israeli company called Syqe Medical, a cannabis inhaler development company, the only metered-dose medical cannabis inhaler that delivers a precise dose of THC.
While the US government swings back and forth on legislation, the big tobacco companies are taking note and ready to pounce.
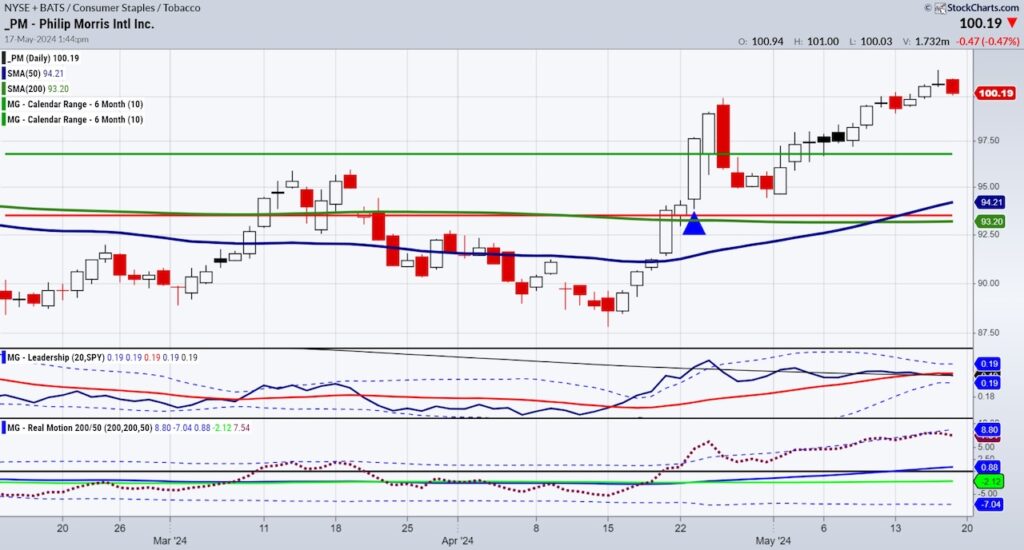
Looking at the daily chart, PM has had a substantial rally from $89 in mid-April to $100.00 plus this past week.
Before Covid the stock was hovering around $70. Then, in 2021, PM peaked at just above $112.
The all-time high happened in May 2017 at $123.55
PM is currently trading on par with the S&P 500 (Leadership indicator).
Real Motion shows momentum waning a bit with a reversion to the mean sell (a failure of the Bollinger band.)
At the end of April 2024, PM cleared back over the January 6-month calendar range high (horizontal green line), which puts this stock in a more longstanding uptrend.
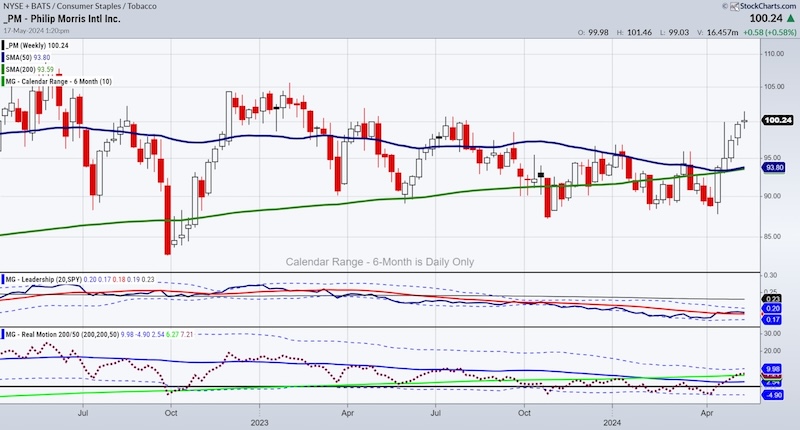
On the weekly chart, the $100 as the key pivotal level is what to watch.
Note how the 50 and 200-week moving averages are converging. Bulls want to see the 50-WMA remain above the 200-WMA.
With this past week’s close right around $100, we have this stock on our radar for the coming week.
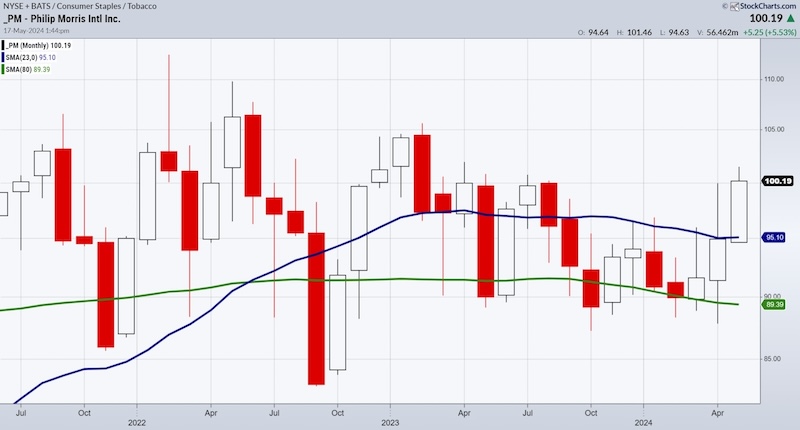
Perhaps the most intriguing chart is the monthly one.
Over the past few weeks, I have written extensively about the 23-month moving average.
When an instrument clears above or breaks below that average, it is either signaling a short-term (2-year) business cycle expansion or contraction.
With Philip Morris, this month, it handily cleared the 23-month MA (blue line).
Hence, we must consider that should PM remain above the 23-month MA going into the end of May and into June, that $100 level is not only a great launching point, but also becomes technical support.
Twitter: @marketminute
The author may have a position in mentioned securities at the time of publication. Any opinions expressed herein are solely those of the author and do not represent the views or opinions of any other person or entity.

: Worrisome to Broader Market?")


