“Manufacturing and net exports have continued to be hard hit by slow global growth and the significant appreciation of the dollar since 2014… Low oil prices have also resulted in large-scale layoffs in the energy sector and adverse spillovers to output and employment in industries that support energy production… For a time, equity prices were down sharply, oil traded at less than $30 per barrel, and many currencies were depreciating against the dollar… In the event oil prices were to fall again, either development could have adverse spillover effects to the rest of the global economy…”
The above is culled from Federal Reserve Chair Janet Yellen’s speech this past Tuesday at the Economic Club of New York.
Among others, the March 29th speech will most likely be remembered for two things. (1) Vigorous reinforcement of the Yellen put. And (2) an open shift toward a weaker dollar.
In the speech, Janet Yellen mentioned ‘oil’ 17 times and ‘dollar’ seven times.
The ultimate goal could not be any clearer – put downward pressure on the US dollar, which would, in turn, put upward pressure on oil, among others.
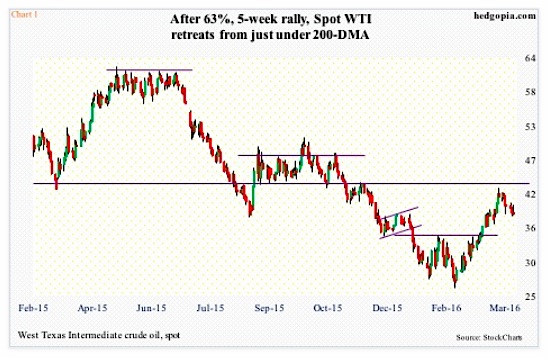
Off the February 11th low, spot West Texas Intermediate crude rallied 63 percent in five weeks (Chart 1 above). But this also preceded a 76-percent collapse between the June 2014 high and the low last month. U.S. shale oil is hurting, with adverse implications for jobs and capital expenditures. A higher price for crude will lessen the pain.
A weaker dollar can help in this regard.
Of course, when it comes to oil, the dollar is not the only variable. Supply/demand dynamics are the most important, and on this score, both fail. That said, since oil is priced in dollars, a weaker dollar is a positive.
As stated earlier, crude oil collapsed since that June 2014 high. That was about the time the U.S. dollar index began to go parabolic (Chart 2). Between the July 2014 low of 80.22 and the March 2015 high of 100.71, the index rallied nearly 26 percent. In nine months!
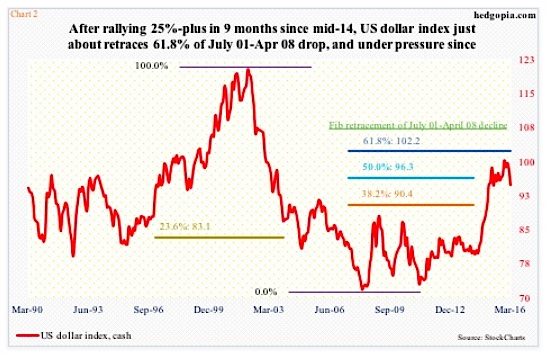
Since that March 2015 peak, the dollar index went sideways for the next nine months, before coming under pressure a tad. For what it is worth, the index retreated after nearly retracing 61.8 percent of the July 2001-April 2008 decline (Chart 2). This has the potential to be an important top.
But the damage has been done.
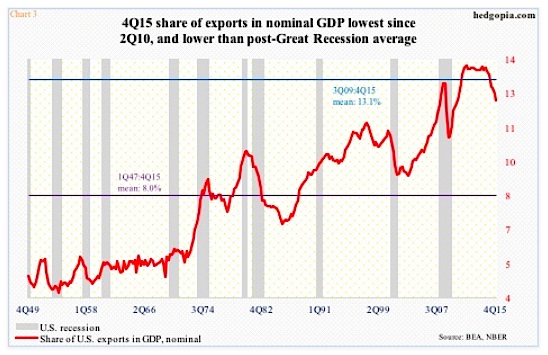
U.S. exports were another casualty of a strong dollar. In 4Q15, exports of goods and services were $2.22 trillion, making up 12.2 percent of nominal GDP – the lowest since 2Q10. Exports’ share peaked at 13.75 percent in 3Q11, later nearly matched by 13.71 percent in 4Q13 (Chart 3). In the past, a sustained drop in the red line has tended to accompany a recession, and the trend is not going the right direction.
A hawkish message from Janet Yellen implying higher interest rates in the future would only increase the odds of a stronger dollar.
A weaker dollar – or prospects of a weaker dollar – is also helping emerging-market assets. Since February 11th, EEM, the iShares MSCI emerging markets ETF, is up 25 percent. On Tuesday, the day Ms. Yellen delivered her speech, it rallied 1.4 percent. On March 16th, when the FOMC switched from a hawkish to dovish message, the ETF jumped two percent.
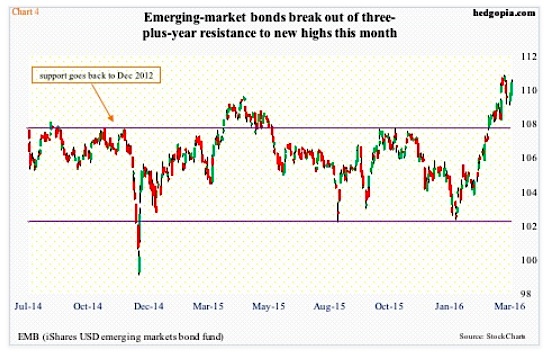
Emerging-market bonds are the same way. EMB, the iShares JPMorgan USD emerging markets bond fund, broke this month out of straight-line resistance going back to December 2012 (Chart 4). Both stocks and bonds are rallying relieved that the dollar has at least stopped going up. These economies hold tons of dollar-denominated bonds, and a strong dollar only hurts, raising the risk of contagion.
continue reading on the next page…


