US Dollar Index – The cash finally gave way, but dollar bulls are not willing to give in that easy.
After going sideways for 13 straight sessions above 102, that support was lost on Thursday when it dropped 1.2 percent, also losing shorter-term moving averages in the process. On Friday, it rallied 0.7 percent to end the session at 102.21.
The next battle will be fought around support at 100.7, or thereabouts, which goes back to March 2015. This was a major breakout last November, and now also approximates the 50-day moving average (100.79).
The weekly chart remains extended.
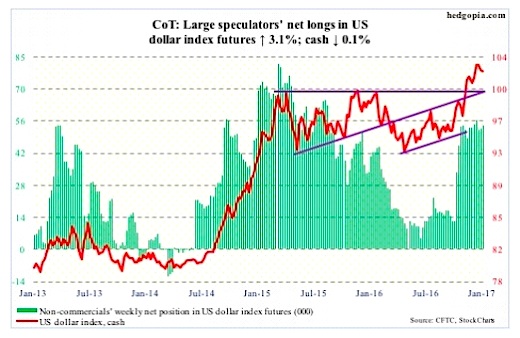
January 6 COT Report Data: Currently net long 54.3k, up 1.6k.
Thanks for reading.
Twitter: @hedgopia
Author may hold a position in mentioned securities at the time of publication. Any opinions expressed herein are solely those of the author, and do not in any way represent the views or opinions of any other person or entity.


