Gold – In the week ended Wednesday, the SPDR Gold ETF (NYSEARCA:GLD) continued to see outflows, losing $353 million. This was the eighth straight weekly loss, totaling $5.4 billion in outflows (courtesy of ETF.com). Spot gold ($1,173.4/ounce), however, rallied in the past couple of weeks.
Gold is showing nice price action of late, and closed the week right on support. Another support zone lies 20 points lower. Price resistance lies at $1,200, which also approximates the 50-day moving average ($1,199.09).
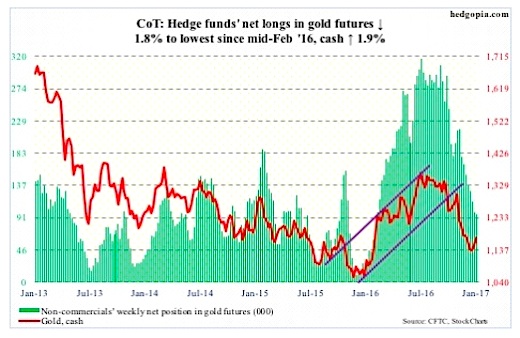
January 6 COT Report Data: Currently net long 96.6k, down 1.8k.
Next COT chart (U.S. Dollar)…


